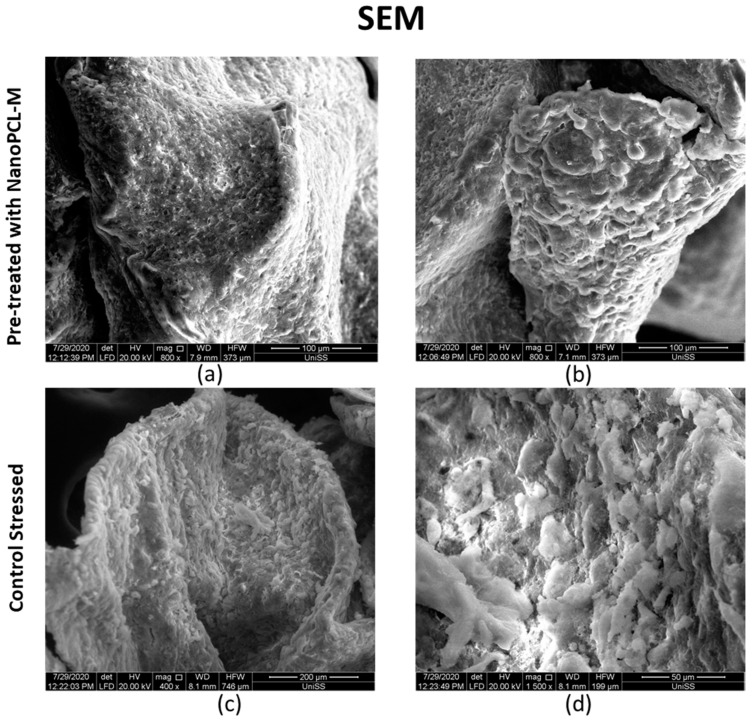
Figure 9.
Images acquired with SEM microscope showing keratinocytes 3D organization. (a,b) represent UV stressed samples pretreated (T) with NanoPCL-M for seven days. (c,d) represent UV stressed samples (CS) kept in culture for seven days without any pretreatment. Scale bar is indicated in each panel.

