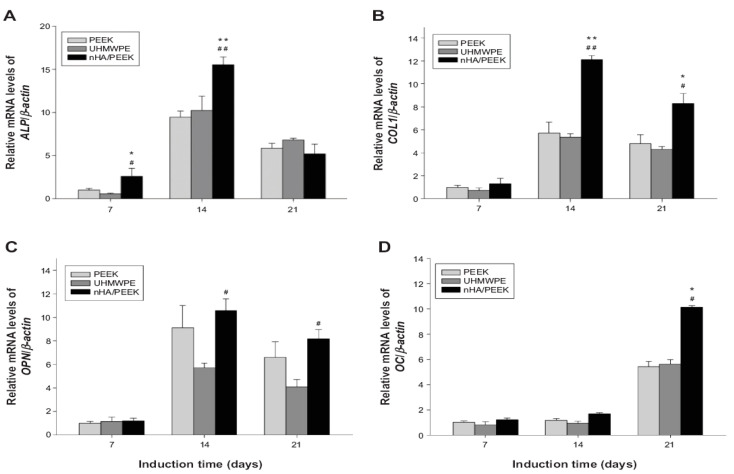
Figure 17.
Differentiation of MC3T3-E1 cells on PEEK, UHMWPE and PEEK/40wt% nHA samples determined by real-time polymerase chain reaction: (a) ALP, (b) COL1, (c) OPN, and (d) OC gene expressions. * Significant difference compared with PEEK (p < 0.05); ** significant difference compared with PEEK (p < 0.01); # significant difference compared with UHMWPE (p < 0.05); ## significant difference compared with UHMWPE (p < 0.01). Reproduced from [87] with permission of Dove Press under the Creative Commons Attribution license.

