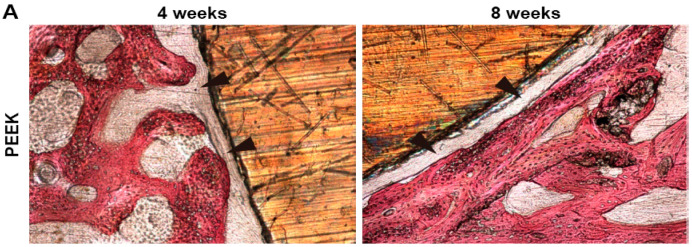
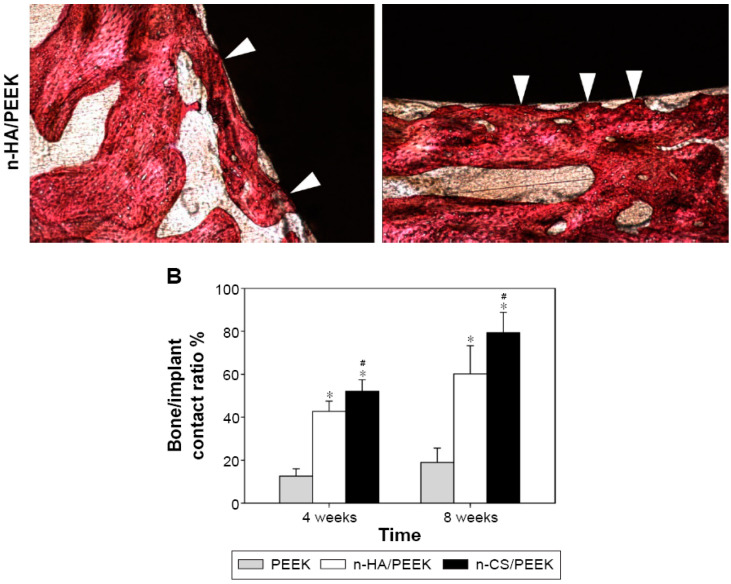
Figure 18.
Histological observation of osseointegration of pure PEEK and PEEK/40wt% nHA samples after 4 and 8 weeks implantation into full-thickness cranial defects of rabbits. (A) Histological images. The black arrows indicate fibrous connective tissue, and white arrows indicate bone contact. (B) Comparison of percentage of bone/implant contact among PEEK, PEEK/40 wt% nHA and PEEK/40 wt% n-CS implants. ∗ denotes a significant difference compared with PEEK (p < 0.01), and # indicates a difference compared with PEEK/40wt% nHA (p < 0.05). Reproduced from [163] with permission of Dove Press under Creative Commons Attribution license.


