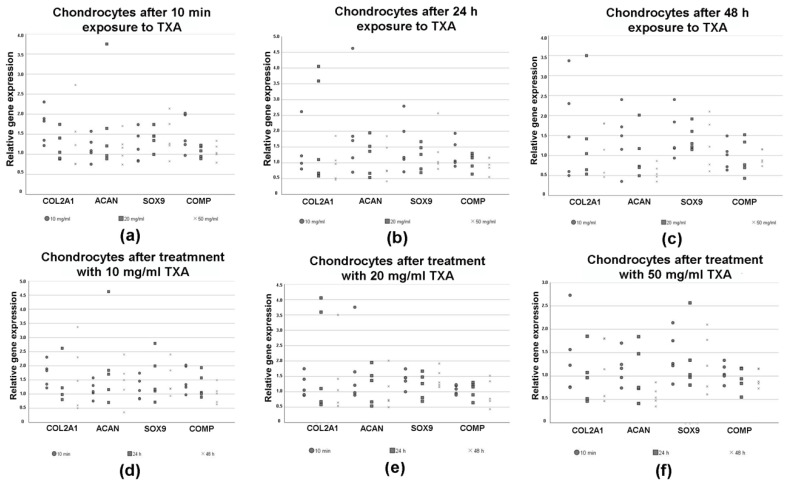
Figure 5.
Relative changes in the expression of chondrogenic marker genes pictured as dot plots as measured by semiquantitative RT-PCR in chondrocytes after treatment with 0 mg/mL (no TXA), 10 mg/mL, 20 mg/mL and 50 mg/mL of tranexamic acid for varying exposure times. Chondrocytes were isolated from the hyaline hip cartilage of five patients that underwent total hip arthroplasty. Cells were incubated in cell culture medium and grown to confluency. After reaching confluency, cells were exposed to 0 mg/mL (no TXA), 10 mg/mL, 20 mg/mL or 50 mg/mL of TXA. The exposure time varied from 10 min to 24 h to 48 h. Each dot represents changes in the relative expression of the chondrogenic marker genes aggrecan (ACAN), collagen type II alpha 1 chain (COL2A1), sex-determining region Y-box 9 (SOX9) and cartilage oligomeric matrix protein (COMP) in a single donor sample in dependence of the TXA concentrations (a–c) and exposure times (d–f). Eukaryotic elongation factor 1α (EEF1A1) was used as the housekeeping gene and for internal controls. Primer details are illustrated in Table 1. d, days; TXA, tranexamic acid, h, hours; min, minutes.

