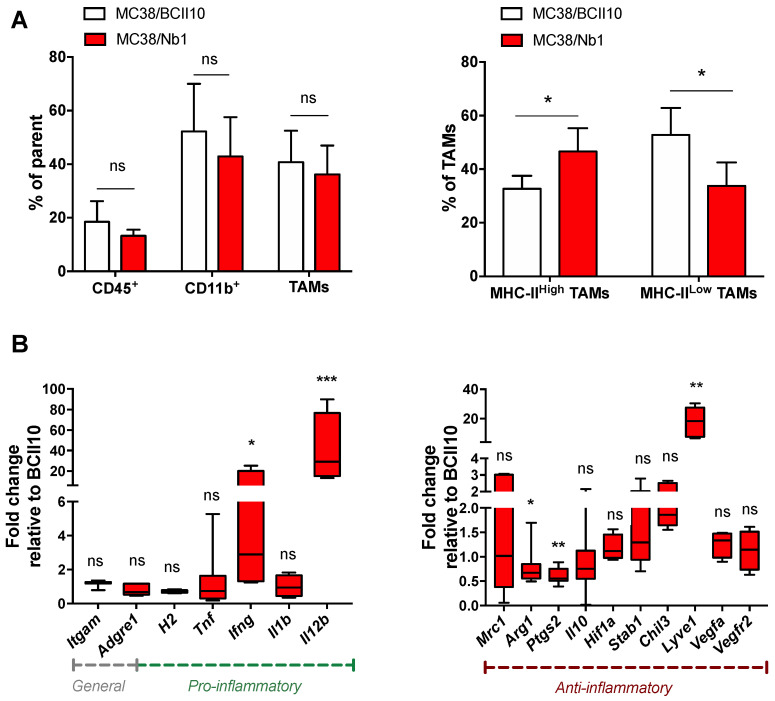
Figure 6.
Production of Nb1 in the tumor microenvironment (TME) of MC38 tumors alters macrophage numbers and function. (A,B) MC38/BCII10 or MC38/Nb1 tumors were grown at the lower back of C57BL/6 mice. Growth of MC38 tumors was monitored on a daily basis. Tumors with a size of 458 ± 40 mm3 were isolated and reduced to single-cell suspensions. (A) Flow cytometry was used to determine the percentage of immune cells (CD45.2+), and within these immune cells, the percentage of myeloid cells (CD45.2+ CD11b+), and within these myeloid cells, the percentage of macrophages (CD45.2+ CD11b+ Ly6G− Ly6C−/low F4/80+). Macrophages were further subdivided into MHC-IIlow or MHC-IIhigh cells. The bar graphs show the percentage of cells and summarize the results of two independent experiments (n = 2, mpc = 6). Statistical analysis was performed by the Student’s t-test and asterisks represent a p-value < 0.05 (*). (B) mRNA was isolated from macrophages sorted from tumors as CD45.2+ CD11b+ Ly6G− Ly6C−/low and F4/80+ cells. RT-qPCR was performed to determine the expression of Itgam (CD11b), Adgre1 (F4/80), H2 (MHC-II), Tnf, Ifng, Il1b, Il12b, Mrc1 (CD206), Arg1, Ptgs1 (Cox2), Il10, Hif1a, Stab1, Chil3 (Ym1), Lyve1, Vegfa and Vegfr2. The box and whisker graph shows the range, mean and standard deviation of the fold in- or decrease in expression of the evaluated markers. The box and whisker graph summarizes the results of two independent experiments (n = 2, mpc = 6). Statistical analysis was performed by the Student’s t-test and asterisks represents p < 0.05 (*), p < 0.01 (**) and p < 0.001 (***).

