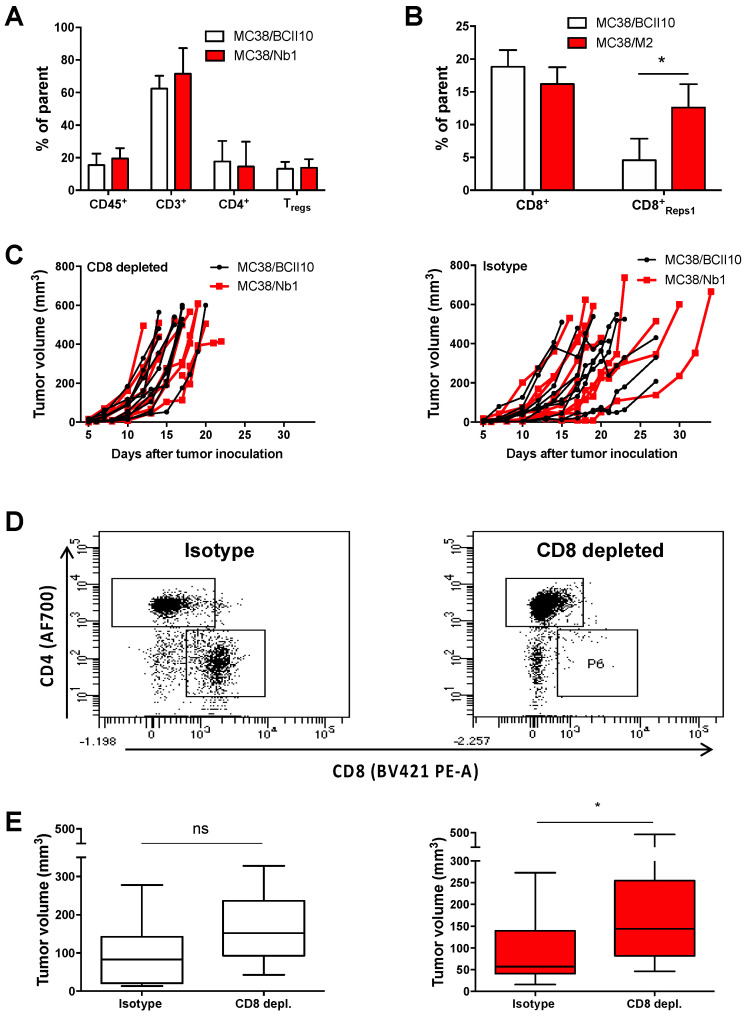
Figure 7.
Production of Nb1 in the TME of MC38 tumors increases the percentage of tumor-specific CD8+ T cells. (A,B) MC38/BCII10 or MC38/Nb1 cells were subcutaneously injected in C57BL/6 mice. Growth of MC38 tumors was monitored on a daily basis. Tumors with a size of 534 ± 68 mm3 were isolated, reduced to single-cell suspensions and subjected to flow cytometry analysis. The bar graphs show the percentage of immune cells (CD45.2+) and, within these immune cells, the percentage of CD3+ T cells, which are further subdivided in CD4+ and CD8+ T cells. Within the CD4+ T cells, we further analyzed Tregs (CD25high CD127−). Within the CD8+ T cells, Reps1-specific cells were analyzed. The bar graphs summarize the results as mean ±SEM of two independent experiments (n = 2, mpc = 10). Statistical analysis was performed by the Student’s t-test, and asterisks represent a p-value < 0.1 (*). (C–E) MC38/BCII10 or MC38/Nb1 cells were injected subcutaneously in C57BL/6 mice. Mice were injected intraperitoneally with 50 µg CD8-depleting or isotype-matched antibodies before tumor cell inoculation. Growth of MC38 tumors was monitored on a daily basis. (D) Depletion of CD8+ T cells was confirmed on splenocytes using flow cytometry. The dot plots show the presence of CD4+ and CD8+ T cells in mice treated with an isotype-matched control antibody, while only CD4+ T cells were detected in mice treated with CD8-depleting antibodies. The dot plots shown are representative of two experiments (n = 2, mpc = 5). (E) The box graphs show the range, mean and standard deviation of the tumor sizes on day 13 in the presence or absence of CD8+ T cells in MC38/BCII10 or MC38/Nb1 tumors. The box and whisker graph summarizes the results of two independent experiments (n = 2, mpc = 5). Statistical analysis was performed by the Student’s t-test and asterisks represent a p-value < 0.05 (*).

