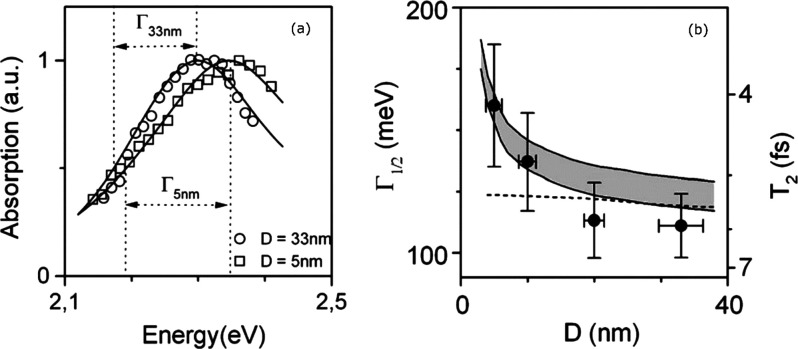
Figure 10.
(a) Photothermal absorption spectra of single 5 and 33 nm gold nanoparticles. The full width at half-maximum (Γ) is shown in the inset. The solid lines are simulations using the Mie theory considering a size-dependent modification for the bulk dielectric constant of gold. (b) Size-dependent surface plasmon width. The solid circles with error bars are experimental data. The dashed and solid lines are simulations of the Mie theory without and with considering size-dependent corrections, respectively. The gray area accounts for the uncertainties in the bulk dielectric function of gold given in ref (117). Adapted with permission from ref (118). Copyright 2006 Royal Society of Chemistry.

