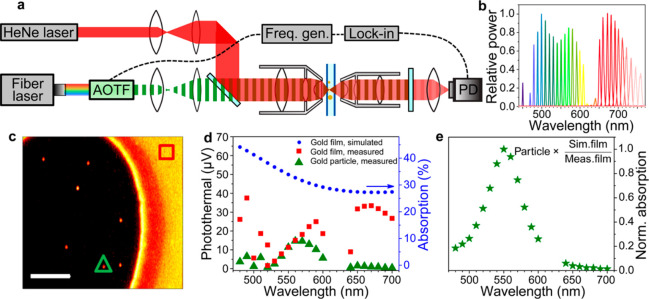
Figure 11.
(a) Schematic of photothermal microscopy in the forward detection mode (transmission mode). For broadband spectroscopy, a broadband fiber laser source equipped with acousto-optic-tunable filter (AOTF) was used. (b) Relative laser powers at different wavelengths selected by the AOTF. (c) Photothermal image of 50 nm gold nanoparticles (round spots) and of a 15 nm thick gold film (uniform signal area in the right side). (d) Photothermal signal vs wavelength for a single gold nanoparticle (green solid triangles, marked also in (c)), thin gold film (red solid squares, marked also in (c)), and the theoretical prediction (blue solid circles) using FDTD simulation. (e) Corrected absorption spectra of the same gold nanoparticle as in (d). The correction is done by normalizing with the ratio of simulated and measured absorption spectra of the thin gold film. Adapted from ref (28). Copyright 2015 American Chemical Society.

