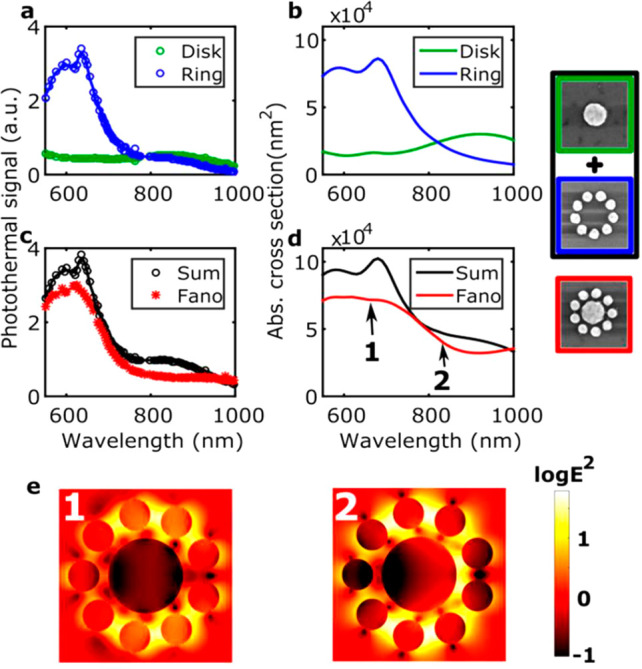
Figure 12.

(a) Absorption spectra measured experimentally of a single central disk (green) and of a single outer ring (blue). Simulated absorption spectra are shown in (b). (c) Sum (black) of the spectra measured for the central disk and the outer ring compared to the absorption spectrum measured for a single Fano cluster (red). Simulated spectra are shown in (d). SEM images of the nanostructures with corresponding line colors of the spectra in (a–d). The size of each SEM image is 500 nm × 500 nm. (e) Electric field intensity maps of a single Fano cluster calculated at positions 1 (left) and 2 (right) as marked in (d) corresponding to the blue Fano peak and the Fano dip, respectively. Reprinted from ref (116). Copyright 2016 American Chemical Society.
