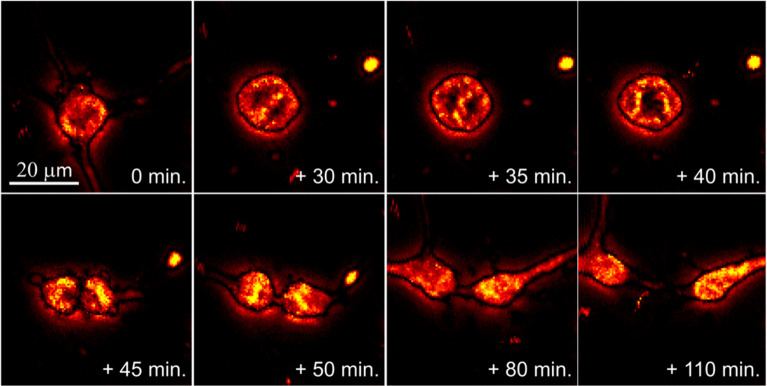
Figure 19.
Time-lapse visualization of cell division of oligodendrocytes in the course of about 2 h, representing different phases of cell division: normal (at 0 min), metaphase (at +30 min) and cytokinesis (at +50 min). The change of the contrast between images is due to the change of proteins localization during the cell replication. Reprinted from ref (147). Copyright 2019 American Chemical Society.

