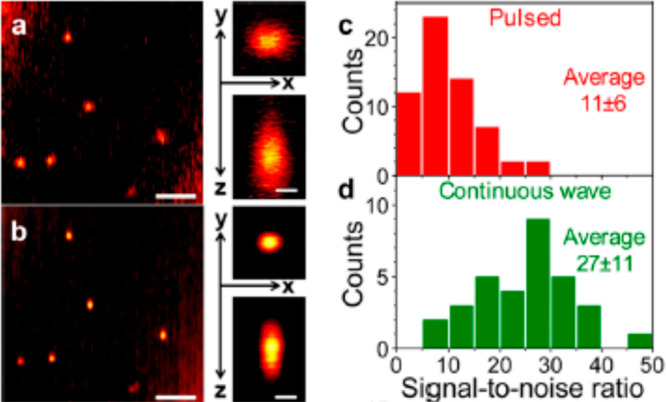
Figure 5.

Photothermal microscopy using pulsed and CW lasers as heating beam sources. (a) Photothermal image of 20 nm gold nanospheres using supercontinuum pulsed laser excitation at 532 nm with a heating intensity of 25 kW/cm2. (b) Same sample area as in (a) but CW laser excitation with a heating intensity of 38 kW/cm2. Scale bars in both (a) and (b) are 2 μm. Right side of (a) and (b): corresponding lateral and axial profile of photothermal signal of a 20 nm gold nanosphere. Scale bar: 300 nm. Histogram of SNR of photothermal signal of single 20 nm gold nanospheres under (c) pulsed excitation and (d) CW excitation. SNR was normalized by the heating power. Reprinted from ref (28). Copyright 2015 American Chemical Society.
