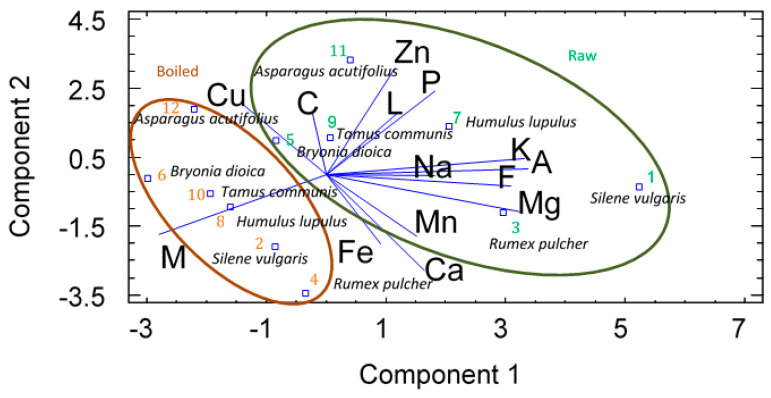
Figure 3.
Principal component analysis (PCA) graphs of nutrients from the raw (1, 3, 5, 7, 9 and 11) and boiled vegetables (2, 4, 6, 8, 10 and 12) investigated. Numbers on the plot represent analyzed vegetables. Sample numbering for raw and boiled respectively: 1, 2: Silene vulgaris; 3, 4: Rumex pulcher; 5, 6: Bryonia dioica; 7, 8: Humulus lupulus; 9, 10: Tamus communis; 11, 12: Asparagus acutifolius L.: lipids; P: proteins; C: carbohydrates; F: fiber; A: ashes; M: moisture.

