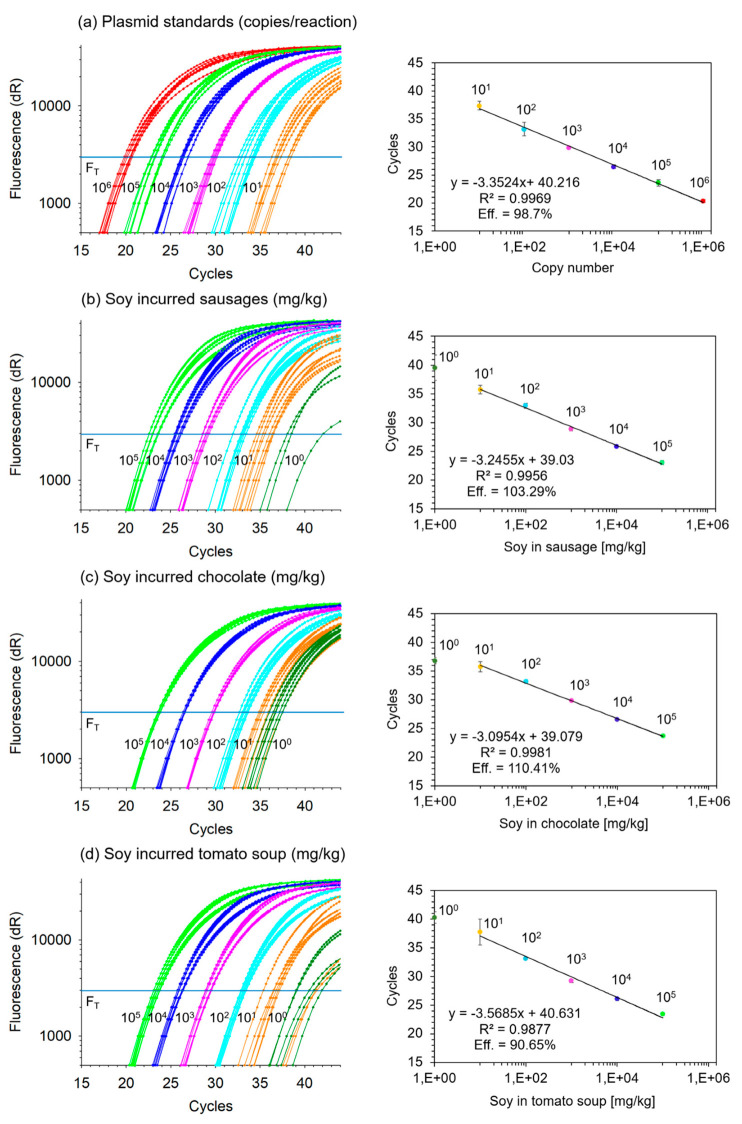
Figure 1.
Lectin qPCR: Amplification curves (left panel) and linear regression (right panel) of fluorescence threshold (FT) cycles versus lectin copy numbers or mg/kg soy in matrix (a) plasmid DNA standards between 101 and 106 copies per reaction; (b) soybean incurred between 100 and 105 mg per kg sausage; (c) soybean incurred between 100 and 105 mg per kg chocolate; (d) soybean incurred between 100 and 105 mg per kg tomato soup. Each level of plasmid DNA standard or incurred soybean sample was analyzed in eight replicate reactions each (error bars indicate standard deviation of replicate means; R2: coefficient of determination; Eff: efficiency).

