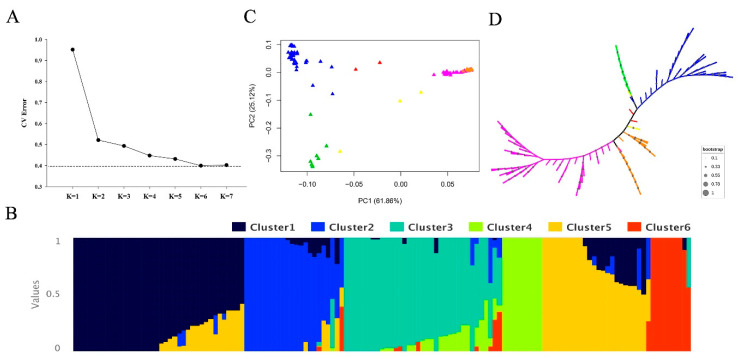
Figure 3.
Population structure analysis. (A) Cross-validation (CV) error of diverse groups (K). The dotted transverse line represents the lowest level. (B) Structure analysis outcome (K = 6). (C) Principal Component Analysis (PCA) (PC1 and PC2). Pink, orange, blue, green, yellow, and red represent the Tej, Trj, Ind, Aus, Aro, and Adm rice subspecies, respectively. (D) NJ-Tree of the rice population. Pink, orange, blue, green, yellow, and red represent the Tej, Trj, Ind, Aus, Aro, and Adm rice subspecies, respectively. Grey dots represent bootstrap information.

