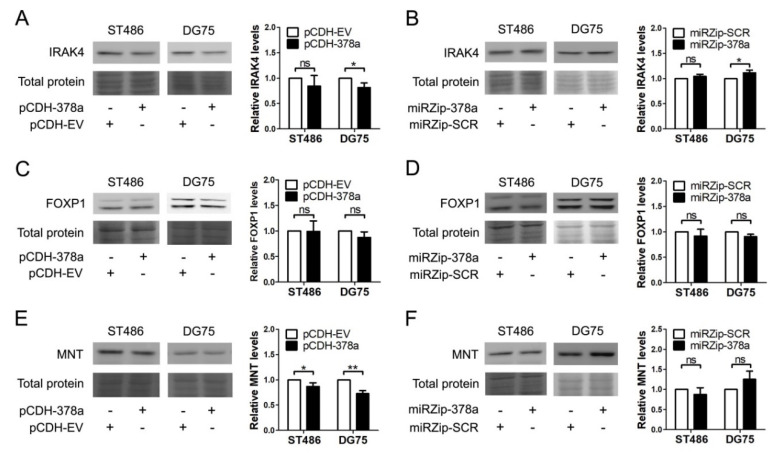
Figure 4.
Analysis of the effect of modulating miR-378a-3p levels upon the protein levels of the target genes. Representative examples of the effect of miR-378a overexpression on IRAK4 (A), FOXP1 (C), and MNT (E). Representative examples of the effect of miR-378a-3p inhibition on IRAK4 (B), FOXP1 (D), and MNT (F). cells. Graphs show the quantification of the protein levels of three to four independent infections. For each protein, the part of the total protein lane corresponding to the position of the protein band is shown as an indication for protein loading. Protein levels were quantified relative to the total protein amount as measured in the complete lane. Uncropped blots can be found in Figure S6. Significant differences were calculated using a paired t-test. * p < 0.05, ** p < 0.01, ns = not significant.

