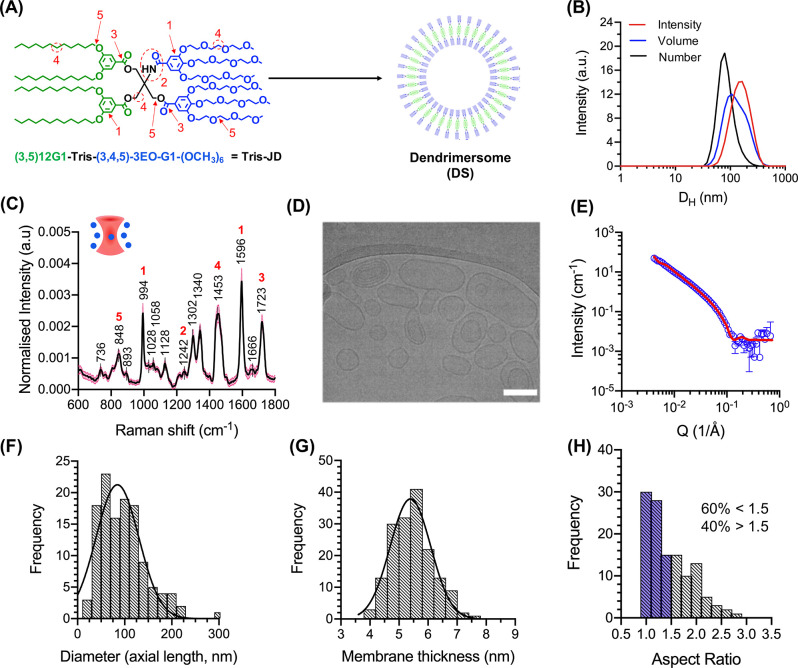
Figure 1.
Characterization of DS self-assembly. (A) Molecular structure of Tris-JD and self-assembly schematic showing formation of a DS. The hydrophobic and hydrophilic parts of the molecule are shaded in green and blue, respectively. (B) DLS traces of DSs showing intensity, volume, and number distribution. (C) Mean, normalized single particle Raman spectrum of DSs in DPBS. The black line shows mean intensity. The pink shaded area shows SD (n = 293). Red numbers correspond to marked functionalities in A: 848 cm–1 = C–O–C skeletal, 994 cm–1 = C–C (aromatic ring) stretching, 1242 cm–1 = amide, 1453 cm–1 = CH2 bend, 1596 cm–1 = C–C (phenyl) stretch, 1723 cm–1 = C=O stretch (ester). For full spectral assignment, see Supplementary Table 1. (D) Representative cryo-TEM image of the self-assembled DS. Scale bar = 100 nm. (E) SANS scattering pattern of DSs prepared by the injection method. The red line represents fit of experimental data using the unilamellar vesicle model in SasView.51 (F) Histogram of measured DS diameters from cryo-TEM images. Mean ± SD determined as 85 ± 45 nm (n = 122 vesicles). (G) Histogram of measured membrane thickness of DS from cryo-TEM images. Mean ± SD nm determined as 5.4 ± 0.7 nm (n = 166 measurements, across 19 vesicles). (H) Histogram of calculated aspect ratios for DSs (n = 122 vesicles). Blue shaded bars represent population with an aspect ratio below 1.5 (classified here as spherical).

