Figure 3.
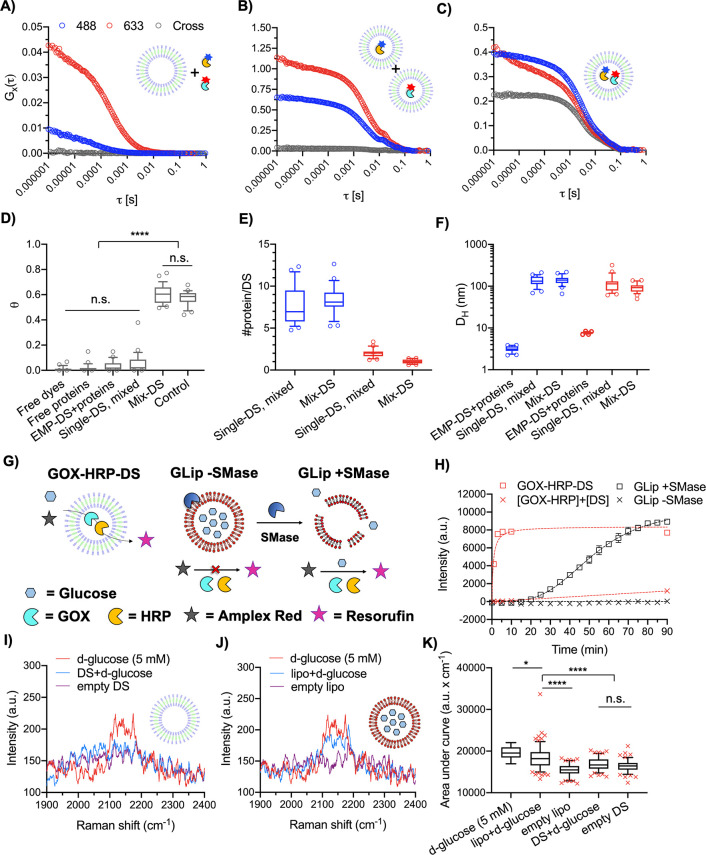
Coloading of two enzymes within the DS and demonstration of a glucose permeable membrane. FCS autocorrelation and FCCS cross-correlation curves of (A) EMP-DS+OG-HRP+AF-GOX = EMP-DS+proteins, (B) OG-HRP-DS+AF-GOX-DS = Single-DS, mixed, and (C) Mix-DS as measured in 488 nm, 633 nm, and cross channels. (D) Box and whisker plot (10–90 percentile) of theta (θ) values (degree of fluorophore cross-correlation between OG-HRP and AF-GOX). Circles show points outside percentile range. Significant cross-correlation was observed for Mix-DS only (N = 1, n = 25. Kruskal–Wallis test with Dunn’s multiple comparisons test. P < 0.05 was considered to be statistically significant; ****P < 0.0001). (E) Box and whisker plot (10–90 percentile) of #protein per DS. Blue and red color denote the #OG-HRP (488 nm) and #AF-GOX (633 nm), respectively, obtained from autocorrelation curve fitting (N = 1, n = 25). Circles show points outside the percentile range. (F) Box and whisker plot (10–90 percentile) of hydrodynamic diameters (DH) obtained from autocorrelation curve fitting (N = 1, n = 25). (G) Schematic to illustrate the glucose permeability of the DS membrane as measured by the Amplex Red assay. Glucose can permeate the membrane of GOX-HRP-DS, and so the cascade can function without the need to permeabilize the membrane as seen for GLip (lipid composition BSM:CH 50:50 w:w), induced by the addition of sphingomyelinase (SMase). (H) Time course of the Amplex Red assay demonstrating DS membrane glucose permeability. For GLip + SMase control, SMase was added at T = 0. GLip serves as a control where enzymatic membrane destabilization is necessary to release glucose. Data are mean ± SEM (N = 1, n = 3). (I, J, K) SPARTA analysis demonstrating that the DS membrane is permeable to glucose. (I, J) Mean, non-normalized SPARTA spectra (cell silent region) of free d-glucose (5 mM), vesicles loaded with 300 mM d-glucose (vesicle+d-glucose), and empty vesicles for the DS and BSM:CH (50:50 w:w) liposomes, respectively. The same spectrum for d-glucose (5 mM) is plotted in I and J. (K) Box and whisker plot (5–95 percentile) of area under the curve for the C–D peak of d-glucose for both loaded and unloaded DS and liposomes (red crosses mark data points outside the percentile range). Area under the curve was calculated between 2100 and 2202 cm–1. A significant signal increase was observed only for the liposome experimental group when loaded with 300 mM d-glucose (one-way ANOVA with Tukey’s multiple comparisons test, with a single pooled variance. P < 0.05 was considered to be statistically significant; ****P < 0.0001). The absence of this increase for the DS means d-glucose has permeated from the DS interior. Successful traps (n) as follows: 5 mM d-glucose (n = 19; reference measurement), lipo+d-glucose (n = 154), empty lipo (n = 101), DS+d-glucose (n = 103), and empty DS (n = 107).

