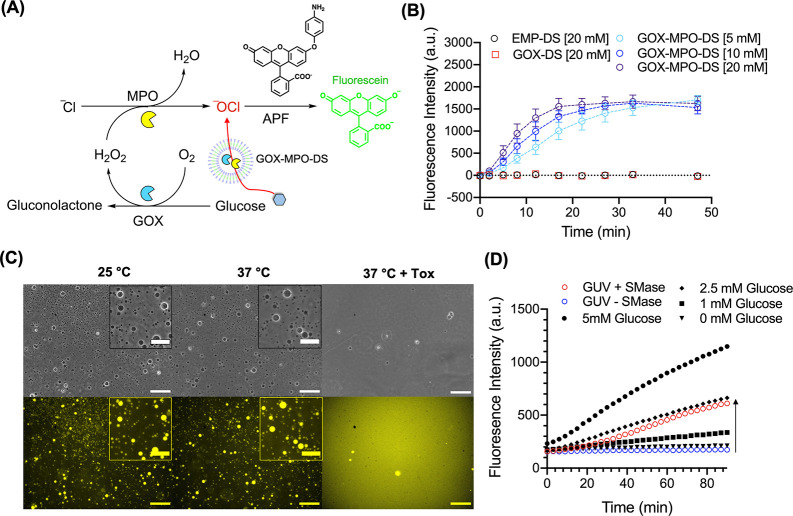
Figure 4.
Glucose initiated production of –OCl by GOX-MPO-DS and reactor switch-on using GUVs as a glucose reservoir. (A) Schematic to illustrate fluorescence detection of –OCl produced by GOX-MPO-DS mixed with glucose and APF. If –OCl is produced, then APF will be O-dearylated to yield fluorescein. (B) Fluorescence vs time graph to show production of –OCl by mixing GOX-MPO-DS with 20, 10, and 5 mM glucose. No background fluorescence was detected for GOX-DS (H2O2 producing sample). Data points show mean ± SEM (N = 3, n = 1). (C) Lysis of GUVs using S. aureus culture supernatants (Tox). Phase contrast (upper panel) and widefield fluorescence (lower panel) microscopy of GUVs incubated at 25 °C in DPBS (left), 37 °C in DPBS (middle), and 37 °C in a DPBS:Tox 1:1 mixture (right) for 2 h. Scale bar of main image: 50 μm. Scale bar of inserts: 25 μm. (D) Fluorescence vs time graph to show the production of –OCl by GOX-MPO-DS using glucose released from GUVs preincubated with SMase (N = 1, n = 1). Black symbols represent GOX-MPO-DS incubated with defined concentrations of free glucose. Arrow indicates cascade switch-on in the presence of SMase.

