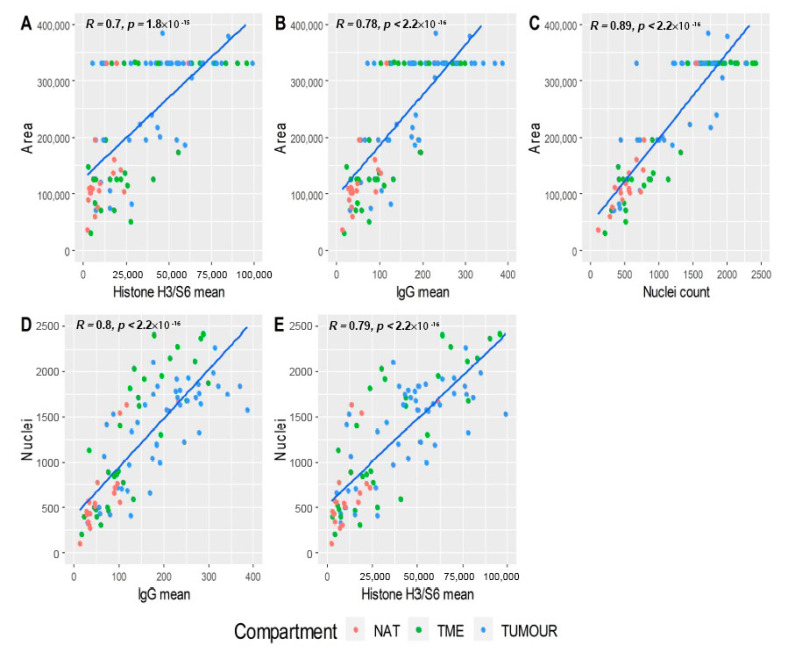
Figure 5.
Assessment of ROI area and nuclei as normalisers. (A) ROI area was plotted against histone H3/S6 means (R = 0.7), (B) IgG means (R = 0.78), (C) and nuclei counts (R = 0.89). Nuclei counts were then evaluated against (D) IgG means (R = 0.8) and (E) histone H3/S6 means (R = 0.79). Some ROIs contained the maximum area (horizontal dots in A–C) and exhibited significant variance in the secondary parameter, indicating that area was not a suitable normalisation method. Nuclei counts (D–E) demonstrated a trend with the secondary parameter; however, correlation was not as significant as that observed for IgG or histone H3/S6. NAT: normal adjacent tissue; TME: tumour microenvironment; Tumour: Tumour region.

