Figure 3.
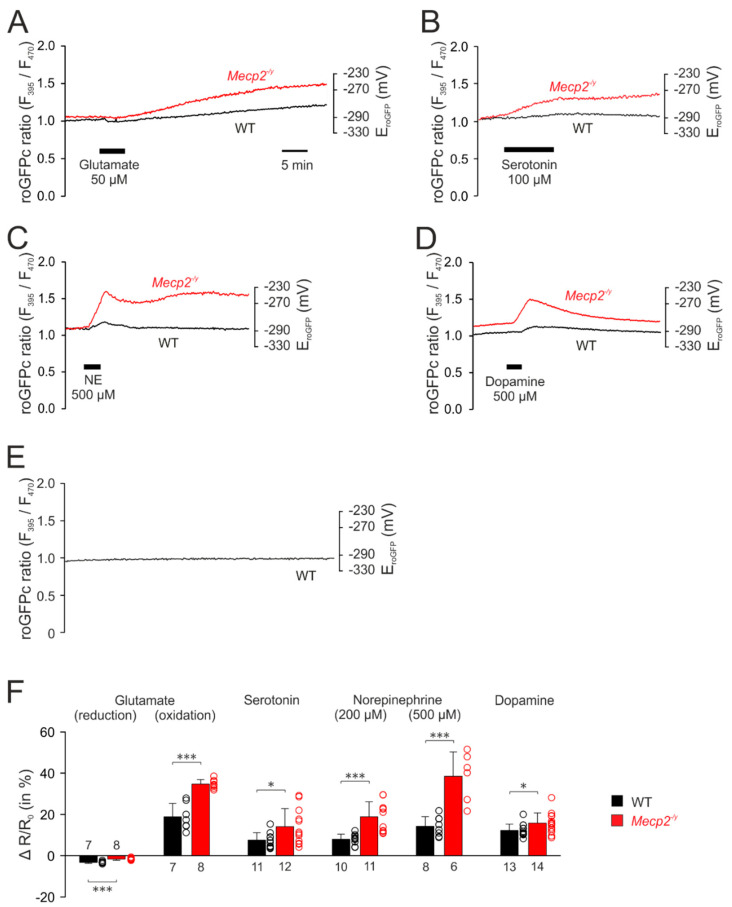
Mecp2−/y neurons show intensified cytosolic redox-responses to neurotransmitter stimulation. (A) Glutamate induced an initial reducing shift. It then turned into a clear oxidation of roGFPc, which was markedly more intense in Mecp2−/y neurons. Plotted are the roGFP ratios and on the right-hand ordinate the corresponding redox potentials are indicated. Time scaling also applies to all other panels. (B) Serotonin also mediated a more intense oxidation of roGFPc in Mecp2−/y neurons. (C) Norepinephrine shifted roGFPc fluorescence to a more oxidized level in Mecp2−/y neurons. (D) Dopamine induced fully reversible oxidizing shifts in both genotypes, which again were more pronounced in Mecp2−/y than in WT neurons. (E) No changes in roGFPc fluorescence were evident, when neurons were just imaged for ~60 min without any additional treatment (n = 6). (F) Statistical summary of the neurotransmitter-mediated redox-alterations in WT and Mecp2−/y neurons. Plotted are the normalized transmitter-induced changes in the roGFPc fluorescence ratio (ΔR/Ro). On the right-hand of each bar, the scatter of the respective data is indicated as a dot plot. Genotype-related differences are indicated by asterisks (* p < 0.05, *** p < 0.001; unpaired t-test/Mann–Whitney rank sum test). The number of cells tested for a given treatment is reported for each bar.

