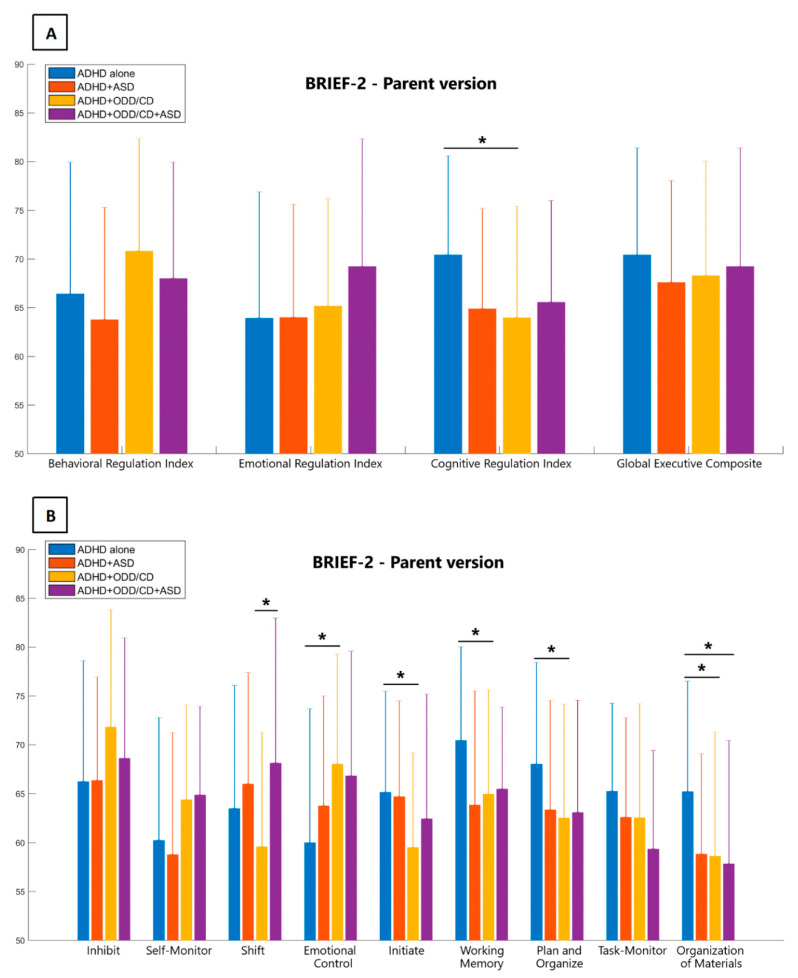
Figure 2.
Scores obtained by the four clinical groups in the brief rating inventory of executive functions questionnaire are illustrated: (A) global indexes and (B) specific subscales are compared between ADHD alone group (blue bars), ADHD+ASD group (red bars), ADHD+ODD/CD group (yellow bars), and ADHD+ASD+ODD/CD group (purple bars). Graphs represent means with standard deviation bars. * p-values < 0.05.

