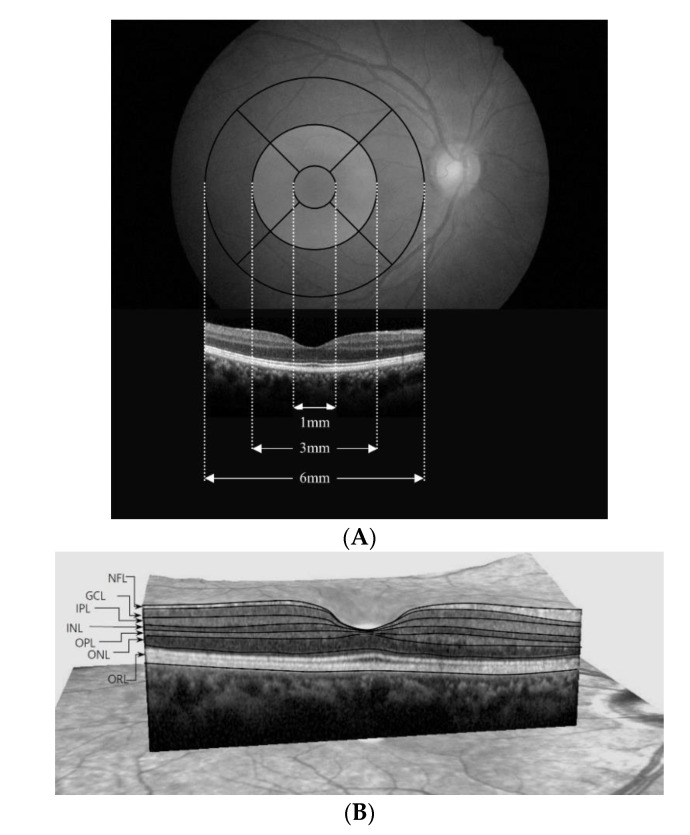
Figure 1.
(A) The Early Treatment Diabetic Retinopathy Study area and spectral-domain optical coherence tomography (OCT) B-scans overlapped to the fundus. Foveal center thickness was defined as the mean value obtained at the foveal center from the horizontal and vertical scans. The thicknesses of inner locations, superior, inferior, nasal, and temporal, were the average measurements take at 490 μm and 500 μm in either direction from the foveal center. The thicknesses of the corresponding outer locations were defined as means measuring 1490 μm and 1500 μm in either direction from the foveal center. The thickness of each retinal layer was the sum of nine subfields. (B) Description of retinal segmentation of spectral-domain OCT. The segmented view of each retinal layer was labeled by the automated segmentation algorithm (with manual correction). NFL, Retinal nerve fiber layer; GCL, Ganglion cell layer; IPL, inner plexiform layer; INL, Inner nuclear layer; OPL, Outer plexiform layer; ONL, Outer nuclear layer; ORL, Outer retinal layer.

