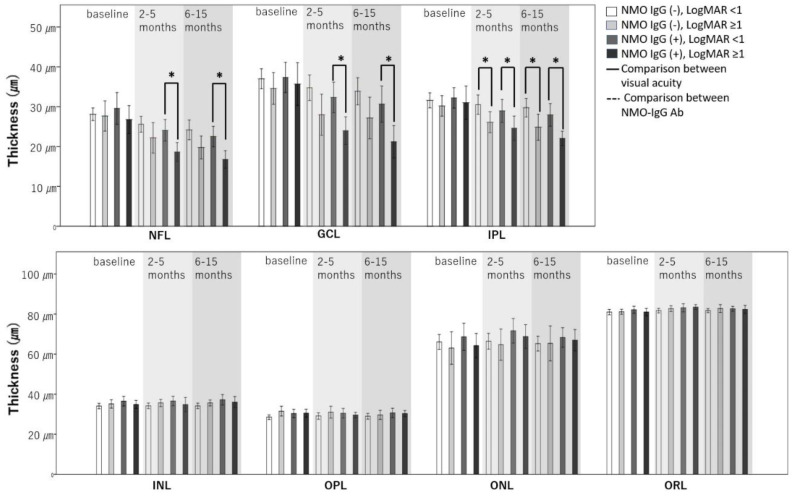
Figure 3.
Changes in the thickness of each layer in the four groups over time. Interactions between time and group according to linear regression with GEE were significant at the p < 0.05 level; NFL p < 0.001; GCL p = 0.001; IPL p < 0.001; OPL p = 0.026; ONL p = 0.01. An asterisk (*) indicates a significant difference between the two groups.

