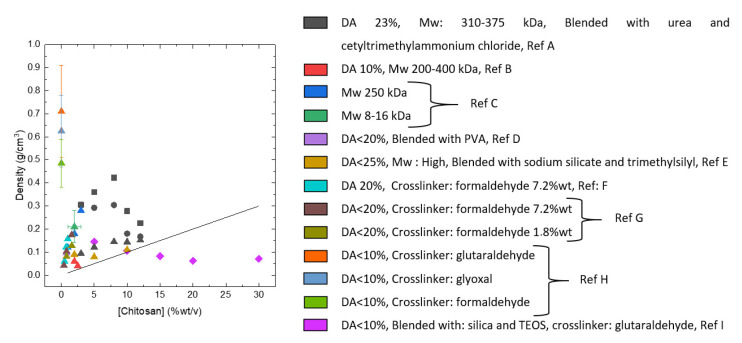
Figure 20.
Variation of the density as a function of the chitosan concentration. Methods of drying are represented by squares for ambient drying, circles for drying at 65 °C, diamonds for freeze drying and triangles for supercritical drying. The solid line represents the density for pure chitosan materials without shrinkage and without mass loss. Ref A: [273], Ref B: [274,275], Ref C: [276], Ref D: [277], Ref E: [278], Ref F: [279], Ref G: [280], Ref H: [281], Ref I: [282].

