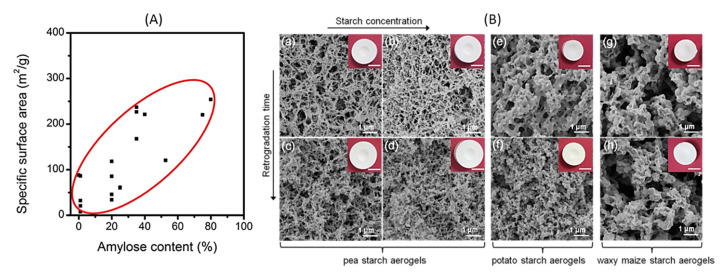
Figure 30.
(A) Specific surface area of monolithic starch aerogels as a function of amylose content [36,43,44,368,369] and (B) SEM images of starch aerogels from various sources at different initial starch concentrations and retrogradation times: (a) pea-5wt%-1day-aerogel, (b) pea-8wt%-1day-aerogel, (c) pea-5wt%-4day-aerogel, (d) pea-8wt%-4day-aerogel, (e) potato-11wt%-1day-aerogel, (f) potato-11wt%-4day-aerogel, (g) waxy maize-11wt%-30day-aerogel, (h) waxy maize-11wt%-45day-aerogel. The scale bar on SEM images is 1 μm, and on the photos of aerogels (insets) is 1 cm [368]. (Reprinted from Carbohydrate Polymers, in press, Zou, F.; Budtova, T., Tailoring the morphology and properties of starch aerogels and cryogels via starch source and process parameter, Copyright 2020, with permission from Elsevier).

