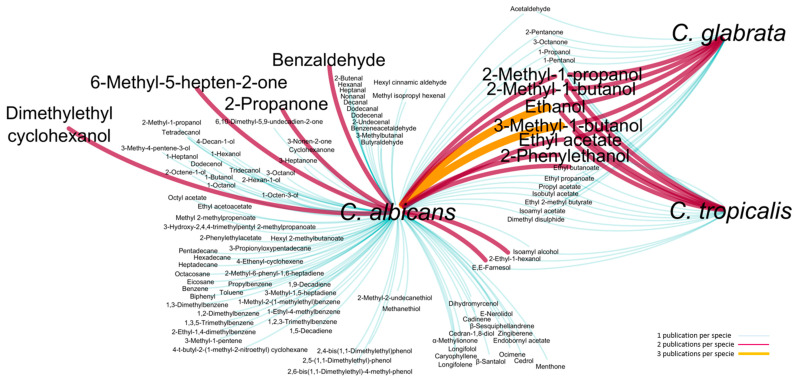
Figure 1.
Visual representation of the volatile metabolites reported in the literature for the C. albicans, C. glabrata and C. tropicalis. Nodes represent Candida species, and the lines make the connection between species and metabolites, some of them common to 2 or 3 species. The color and line thickness represent the number of citations of each metabolite per specie: 1 (white blue), 2 (violet) and 3 (orange) publications [26,27,28,29,30,31,32,33,34,35].

