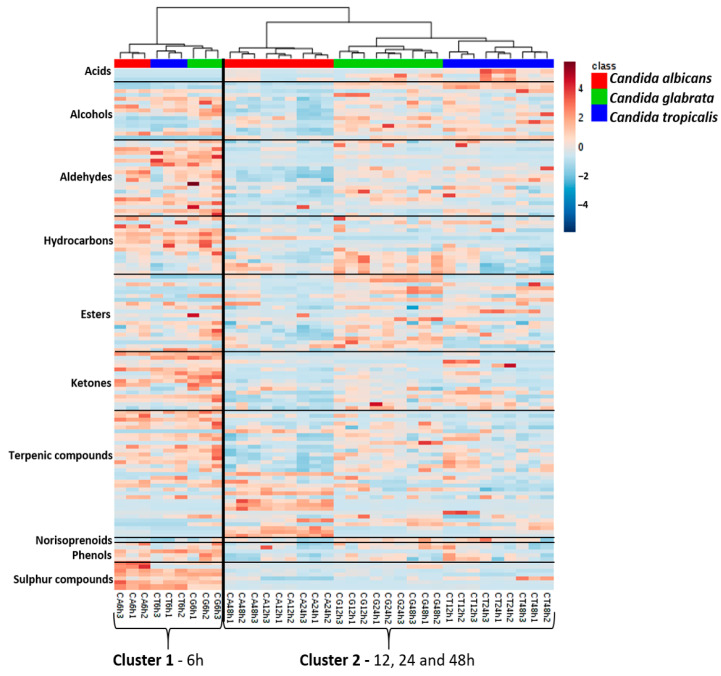
Figure 6.
Heatmap and hierarchical cluster analysis representation of 126 metabolites putatively identified from Candida species cultures. The heatmap comprises the data obtained from the cultures of C. albicans, C. glabrata and C. tropicalis at 37 °C and 6, 12, 24 and 48 h of growth time. Cluster 1—samples from 6 h of growth, and Cluster 2—samples from 12, 24 and 48 h of growth. The area of each variable was autoscaled and normalized by the sum for all samples (with a GC peak previously normalized by CFU mL−1). n = 3 for each condition under study. The content of each metabolite was illustrated through a chromatic scale (from blue, minimum, to red, maximum). Hierarchical cluster analysis using the Ward’s cluster algorithm to the data set was also included.

