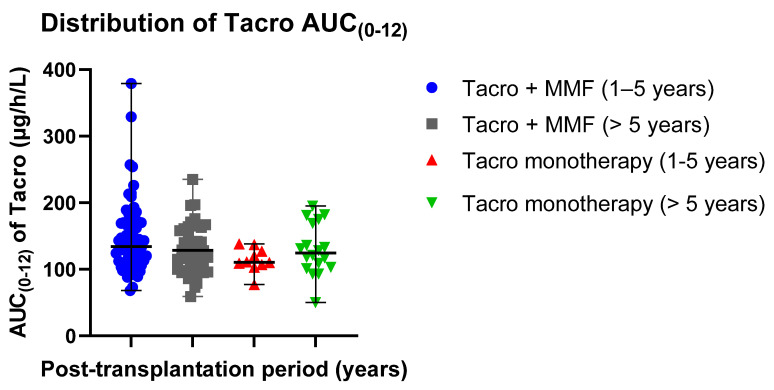
Figure 2.
Distribution of the Tacro AUC (0–12) exposure values in the study groups: Tacro + MMF and Tacro monotherapy; MMF—mycophenolate mofetil; Tacro—tacrolimus. Scatter plots display the individual AUC(0–12) exposure values’ distribution from the median in the Tacro-receiving study groups (median ± SE): 134.00 ± 6.251 µg/h/L (Tacro + MMF, post-transplantation time: 1–5 years) versus 110.50 ± 5.675 µg/h/L (Tacro monotherapy, post-transplantation time: 1–5 years); 128.50 ± 5.532 µg/h/L (Tacro + MMF, post-transplantation time > 5 years) versus 124.50 ± 8.978 µg/h/L (Tacro monotherapy, post-transplantation time > 5 years). Respectively, mean values (mean ± SD) were as follows: 146.97 ± 53.039 µg/h/L (Tacro + MMF, post-transplantation time 1–5 years) versus 113.90 ± 17.947 µg/h/L (Tacro monotherapy, post-transplantation time: 1–5 years); 129.73 ± 36.695 µg/h/L (Tacro + MMF, post-transplantation time > 5 years) versus 129.72 ± 38.092 µg/h/L (Tacro monotherapy, post-transplantation time > 5 years).

