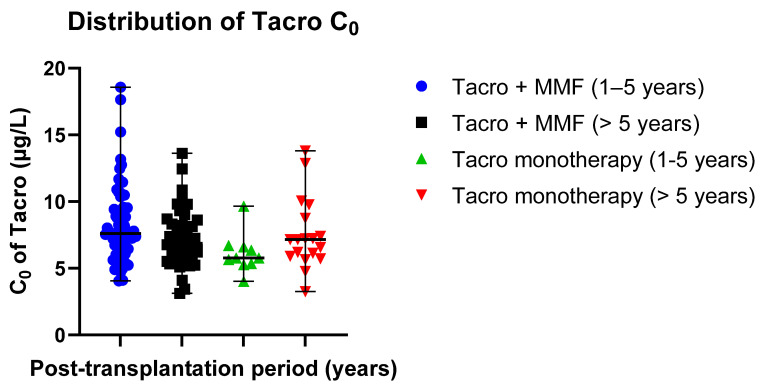
Figure 3.
Distribution of Tacro C0 values in the study groups: Tacro + MMF and Tacro monotherapy; MMF—mycophenolate mofetil; Tacro—tacrolimus. Scatter plots display the individual C0 values’ distribution from the median in the Tacro-receiving study groups (median ± SE): 7.62 ± 0.33 µg/L (Tacro + MMF, post-transplantation time: 1–5 years) versus 5.77 ± 0.46 µg/L (Tacro monotherapy, post-transplantation time: 1–5 years); 6.88 ± 0.32 µg/L (Tacro + MMF, post-transplantation time > 5 years) versus 7.16 ± 0.63 µg/L (Tacro monotherapy, post-transplantation time > 5 years). Respectively, mean values (mean ± SD): 8.23 ± 2.81 µg/L (Tacro + MMF, post-transplantation time: 1–5 years) versus 6.12 ± 1.47 µg/L (Tacro monotherapy, post-transplantation time: 1–5 years); 7.23 ± 2.14 µg/L (Tacro + MMF, post-transplantation time > 5 years) versus 7.54 ± 2.67 µg h/L (Tacro monotherapy, post-transplantation time > 5 years).

