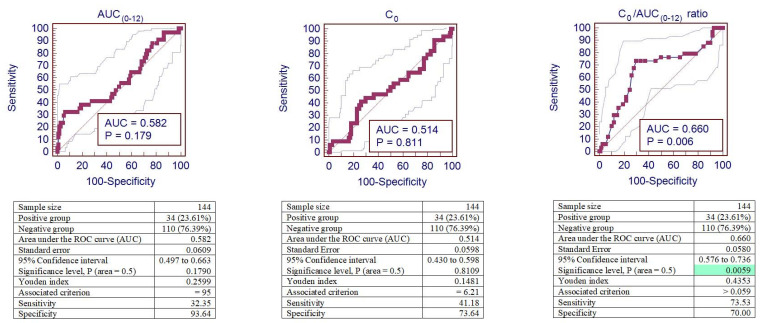
Figure 4.
ROC curves of AUC(0–12), C0, and the C0/AUC(0–12) ratio for tacrolimus-induced IFTA. Analysis of sensitivity and specificity for IFTA represented by the ROC curves (area under the receiver operator curve—AUROC) in patients after kidney transplantation. The background green color remarks the significant area. IFTA—interstitial fibrosis and tubular atrophy.

