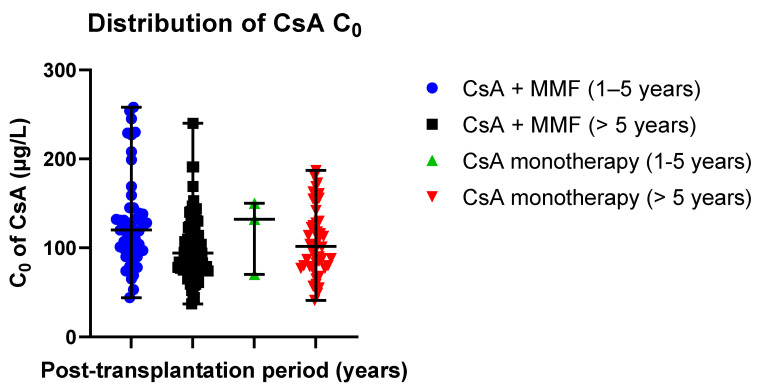
Figure 6.
Distribution of CsA C0 values in the study groups: CsA + MMF and CsA monotherapy; MMF—mycophenolate mofetil; CsA—cyclosporine. Scatter plots display the individual C0 values’ distribution from the median in CsA-receiving study groups (median ± SE): 120.00 ± 7.26 µg/L (CsA + MMF, post-transplantation time: 1–5 years) versus 132.00 ± 24.23 µg/L (CsA monotherapy, post-transplantation time: 1–5 years); 94.00 ± 3.39 µg/L (CsA + MMF, post-transplantation time > 5 years) versus 101.50 ± 5.51 µg/L (CsA monotherapy, post-transplantation time > 5 years). Respectively, the mean values (mean ± SD) were as follows: 128.55 ± 51.84 µg/L (Tacro + MMF, post-transplantation time: 1–5 years) versus 117.33 ± 41.97 µg/L (Tacro monotherapy, post-transplantation time: 1–5 years); 97.90 ± 33.23 µg/L (Tacro + MMF, post-transplantation time > 5 years) versus 106.54 ± 37.39 µg h/L (Tacro monotherapy, post-transplantation time > 5 years).

