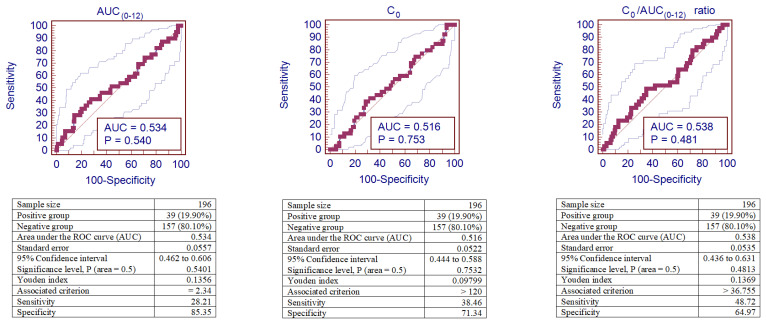
Figure 7.
ROC curves of AUC(0–12), C0, and the C0/AUC(0–12) ratio for CsA-induced IFTA. Analysis of sensitivity and specificity for IFTA represented by the ROC curves (area under the receiver operator curve—AUROC) in patients after kidney transplantation. IFTA—interstitial fibrosis and tubular atrophy.

