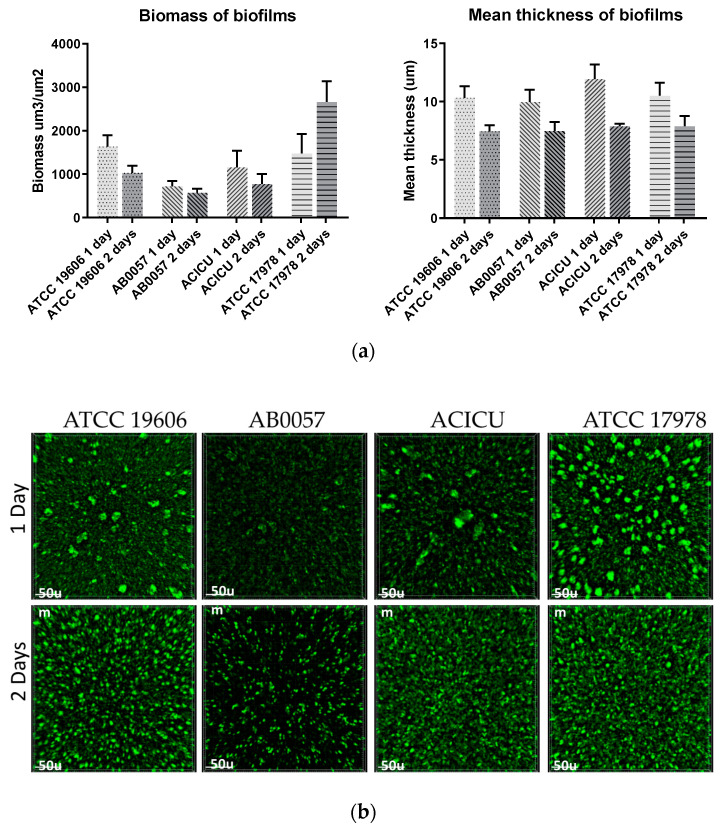
Figure 5.
Analysis of the biofilms formed by ATCC 19606, ATCC 17078, AB5007 and ACICU using fluorescence microscopy. (a) shows the quantification of biofilm biomass and thickness of ATCC 19606 and controls after 24 and 48 h. (b) Fluorescence microscopy images of biofilms stained with Syto-9 and taken using the 20× lens after 24 and 48 h (top).

