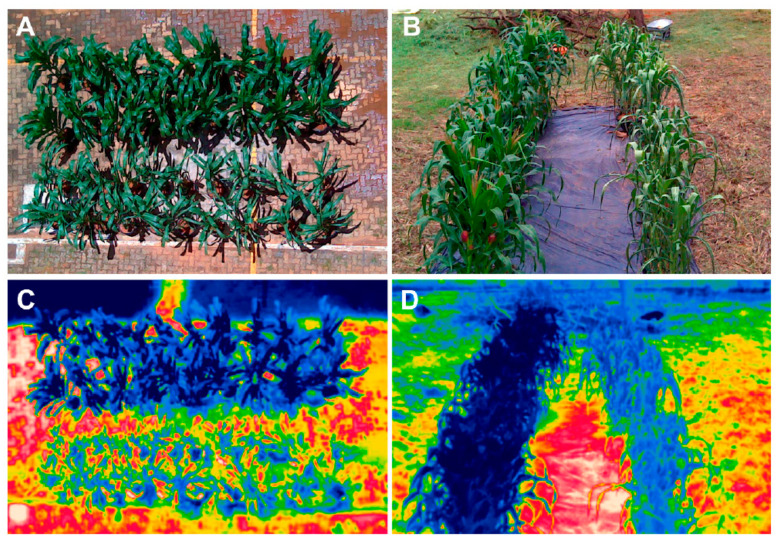
Figure 6.
Thermographic image data used to evaluate drought stress in maize plants. In (A,C) the top row consists of well-watered plants, while the bottom row is drought-stressed. Similarly, in (B,D), well-watered plants are in the left row, while drought-stressed plants are in the right. Reprinted with permission from [68]. ©2019 Casari et al.

