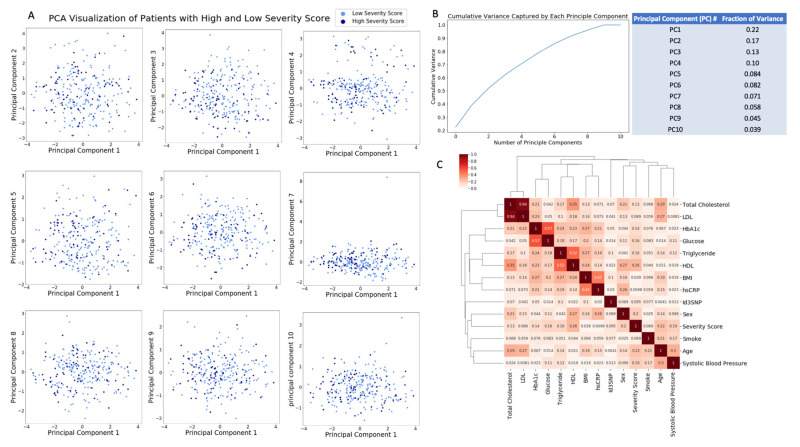
Figure 2.
PCA and correlation matrix of patients with high and low severity score generated using conventional risk factors and Id3 SNP. PCA plots between PC1 and PC2-PC10 (A) and low fraction of variance captured by each principal component (PC) (B) suggested that patients with high and low severity score cannot be differentiated by using PCA based on their conventional risk factors and Id3 SNPs. Correlation matrix also demonstrates low-intermediate correlation between severity score and conventional risk factors and Id3 SNP (C). Both PCA and correlation matrix analysis indicates a challenge in developing a model/strategy to classify patients into high and low risk severity score.

