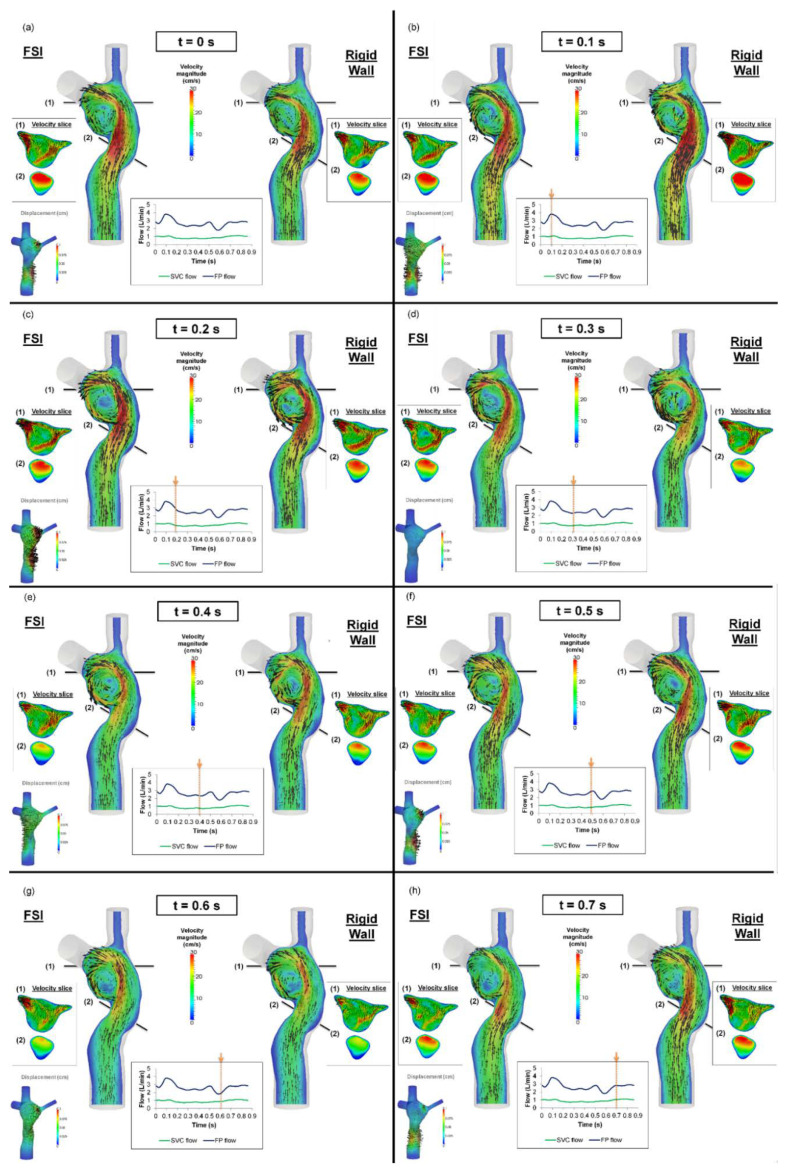
Figure 8.
Flow field of the TCPC from the fluid-structure interaction (FSI) and rigid wall simulations (a–h) from t = 0 s to t = 0.7 s, at a 0.1 s interval. The displacement field of the FSI simulation at the corresponding time point is shown in the bottom-left corner. FP: Fontan pathway, SVC: superior vena cava, TCPC: total cavopulmonary connection.

