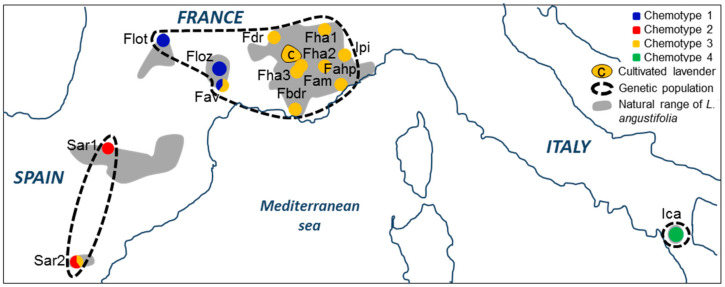
Figure 1.
Chemical and genetic structure of the 14 native sampled sites (N = 65) and 5 cultivated fields (N = 25). Grey shading indicates the natural range of the true lavender Lavandula angustifolia. The position of the pie chart indicates the original location of the sampled site. The color of the pie chart designates the chemical cluster membership. The black dashed lines delimit the three genetic units identified with DAPC (discriminant analysis on principal component) on the AFLP (amplified fragment length polymorphism) fingerprinting genotypes. The cultivated fields are grouped in an area with the letter c.

