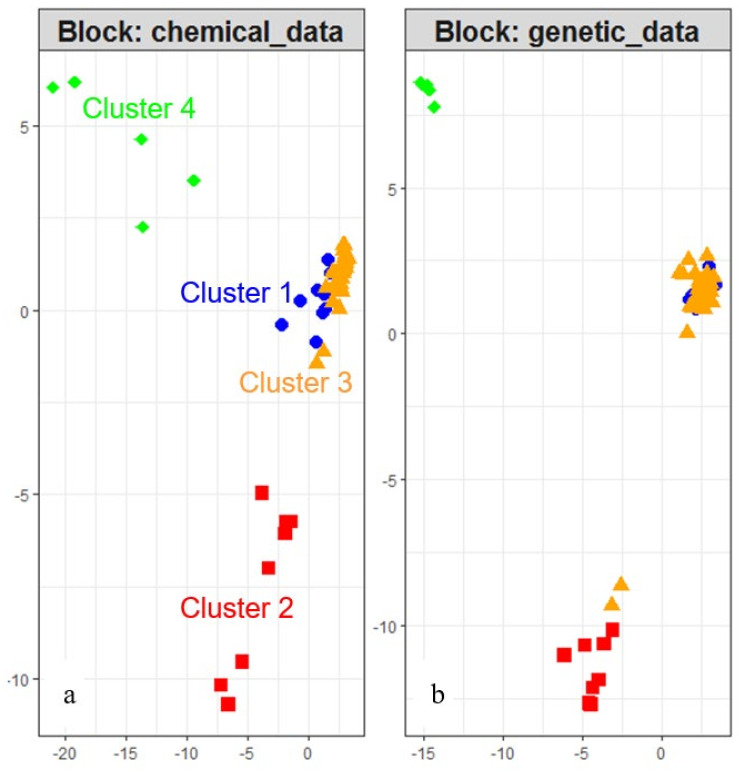
Figure 2.
Congruency of the structures of individuals between chemical (a) and genetic dataset (b), resulting from DIABLO (data integration analysis for biomarker discovery using latent variable approaches for omics studies) analysis. Each point represents one individual placed according to its projection in the subspace defined by the latent variables of the multivariate model (Ntotal = 90; Ncluster1 = 12; Ncluster2 = 8; Ncluster3 = 65; Ncluster4 = 5). This plot enables to visualize similarities between samples. The four different symbols materialized the 4 chemotypes identified by DAPC on 90 individuals of 14 wild sampled sites of lavender and 5 cultivated fields.

