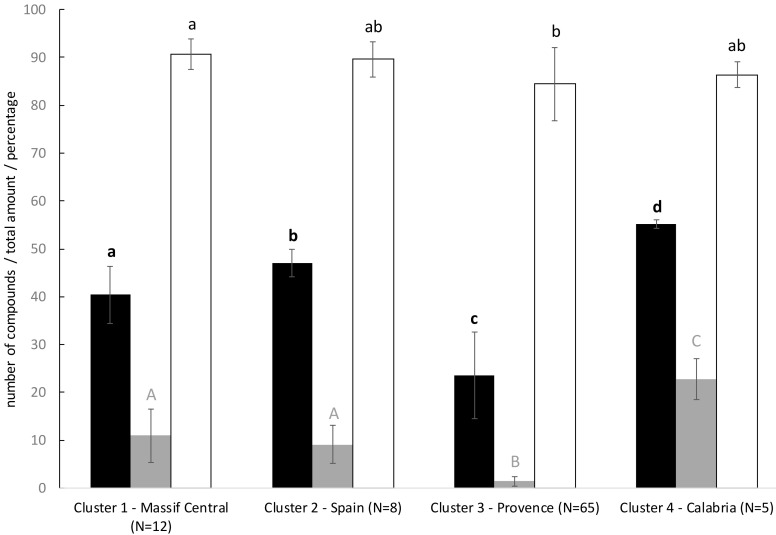
Figure 3.
Number of compounds (black bars), total amount of volatile compounds (grey bars; internal standard equivalent per g of dry inflorescence) and percentage of monoterpenes (white bars) in the four clusters identified by DAPC on the chemical data. Black bold letters in the lower case indicate significant difference in the number of compounds between clusters. Grey letters in the upper case indicate significant difference for total amount of volatile compounds. Black letters in the lower case indicate significant difference for percentage of monoterpenes. Pairwise comparisons were performed with pairwise Wilcoxon tests. The significance level was set to p = 0.05.

