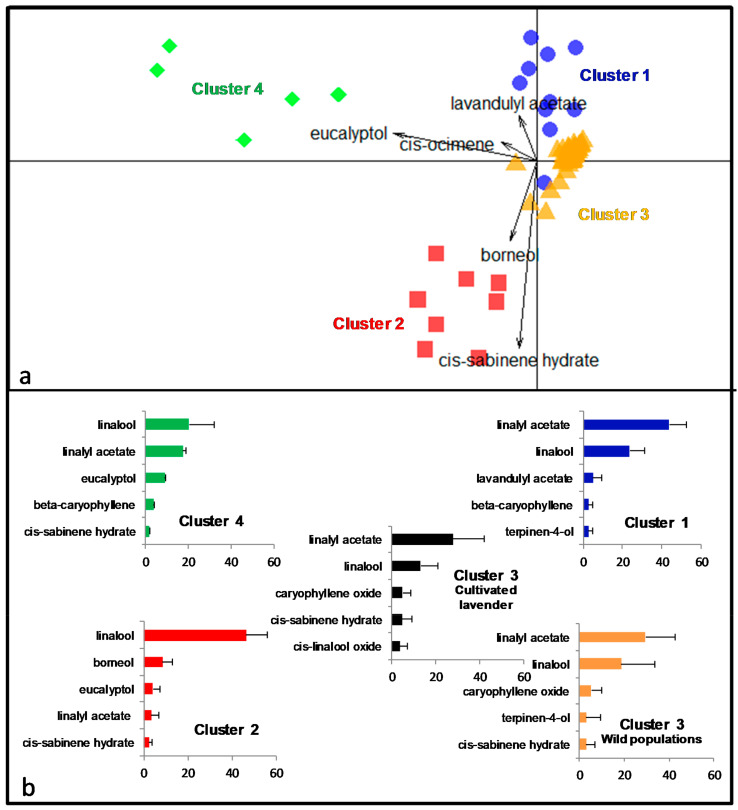
Figure 4.
(a) Discriminant analysis based on the chemical composition of 90 individuals from 14 wild sampled sites and 5 cultivated fields of lavender (Ncluster1 = 12; Ncluster2 = 8; Ncluster3 = 65; Ncluster4 = 5). The arrows indicate the most discriminant compounds. The different symbols materialized the 4 clusters identified by DAPC. (b) For each cluster, the mean percentage of the total amount ± SD for the five major compounds is represented. For cluster 3, the composition of wild (N = 40) and cultivated (N = 25) populations are separated.

