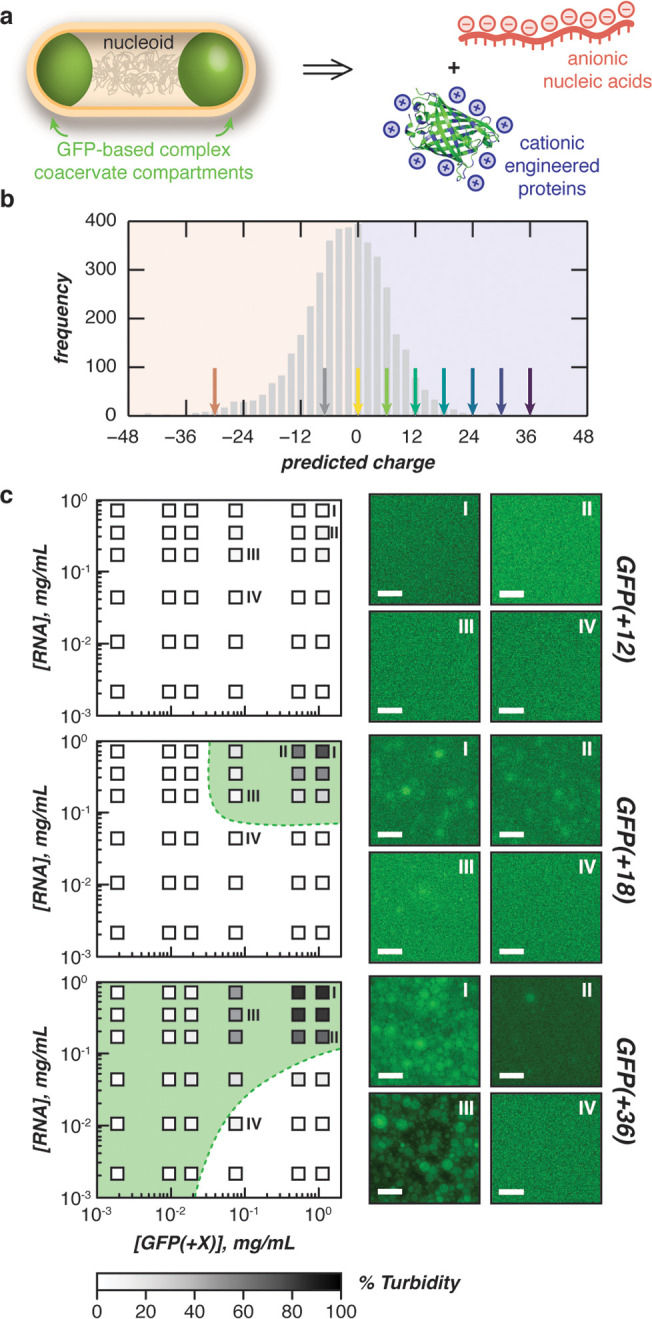
Figure 1.

Phase separation of engineered proteins in vitro. (a) Schematic for the design of intracellular complex coacervates in E. coli between anionic nucleic acids and cationic engineered proteins. (b) Distribution of proteins in the E. coli proteome (UP000002032) by expected charge (bin width = 2). Arrows indicate the predicted charge of engineered GFPs used in this study. (c) Phase diagrams of purified GFP variants with purified total cellular RNA mixed at the indicated concentrations (boxes) in a physiological buffer (70 mM K2HPO4, 60 mM KCl, 40 mM NaCl, pH 7.4) as determined by turbidity (left). Shading (within boxes) depicts turbidity values, green dashed lines represent observed phase boundaries, green shading represents two phase regions. Fluorescence microscopy images of indicated mixtures (right). Phase diagrams for GFP(+24) and GFP(+30) can be found in the Supporting Information. Scale bars, 10 μm.
