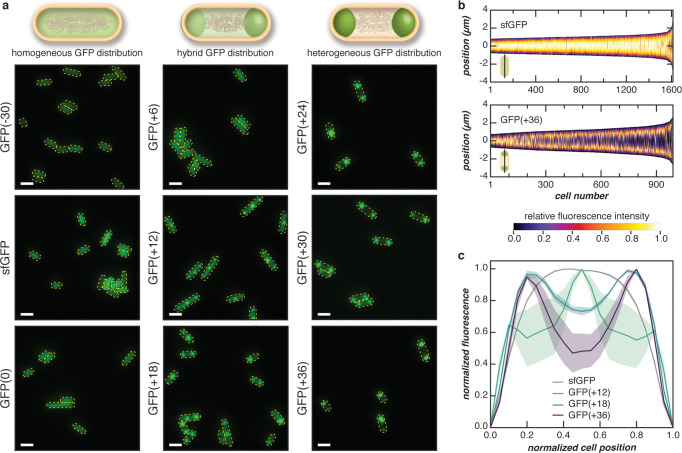
Figure 2.
Phase separation of supercationic GFP in E. coli. (a) Fluorescent microscopy images of cells expressing GFP variants with different net charge at 24 h after induction. Negatively charged or neutral variants (left column) were evenly distributed throughout the cell, while supercationic variants demonstrated punctate fluorescence localized to the cell poles (right column). The localization of fluorescence was more defined with increasing cationic charge as exemplified by the charge-dependent increase in localization observed with GFP variants of intermediate charge (middle column). Scale bars, 2 μm. (b) Localization patterns of sfGFP and GFP(+36) were quantified from microscopy images, such as those shown in (a). Vertical heatmaps representing GFP intensities across the long cell axis were generated using microbeJ. Demographs display the GFP intensity across a population of cells arranged by cell length. (c) The localization of GFP when normalized to cell position demonstrated transitions as GFP charge reached +12 and +18. Each line represents the normalized medial fluorescence with respect to normalized cell position, and the shaded region represents the SEM of observed values. For (b) and (c), three independent experiments were performed with at least 120 cells analyzed per experiment. Analysis for all GFP variants is found in Supplementary Figures 4–9.

