
Figure 4.
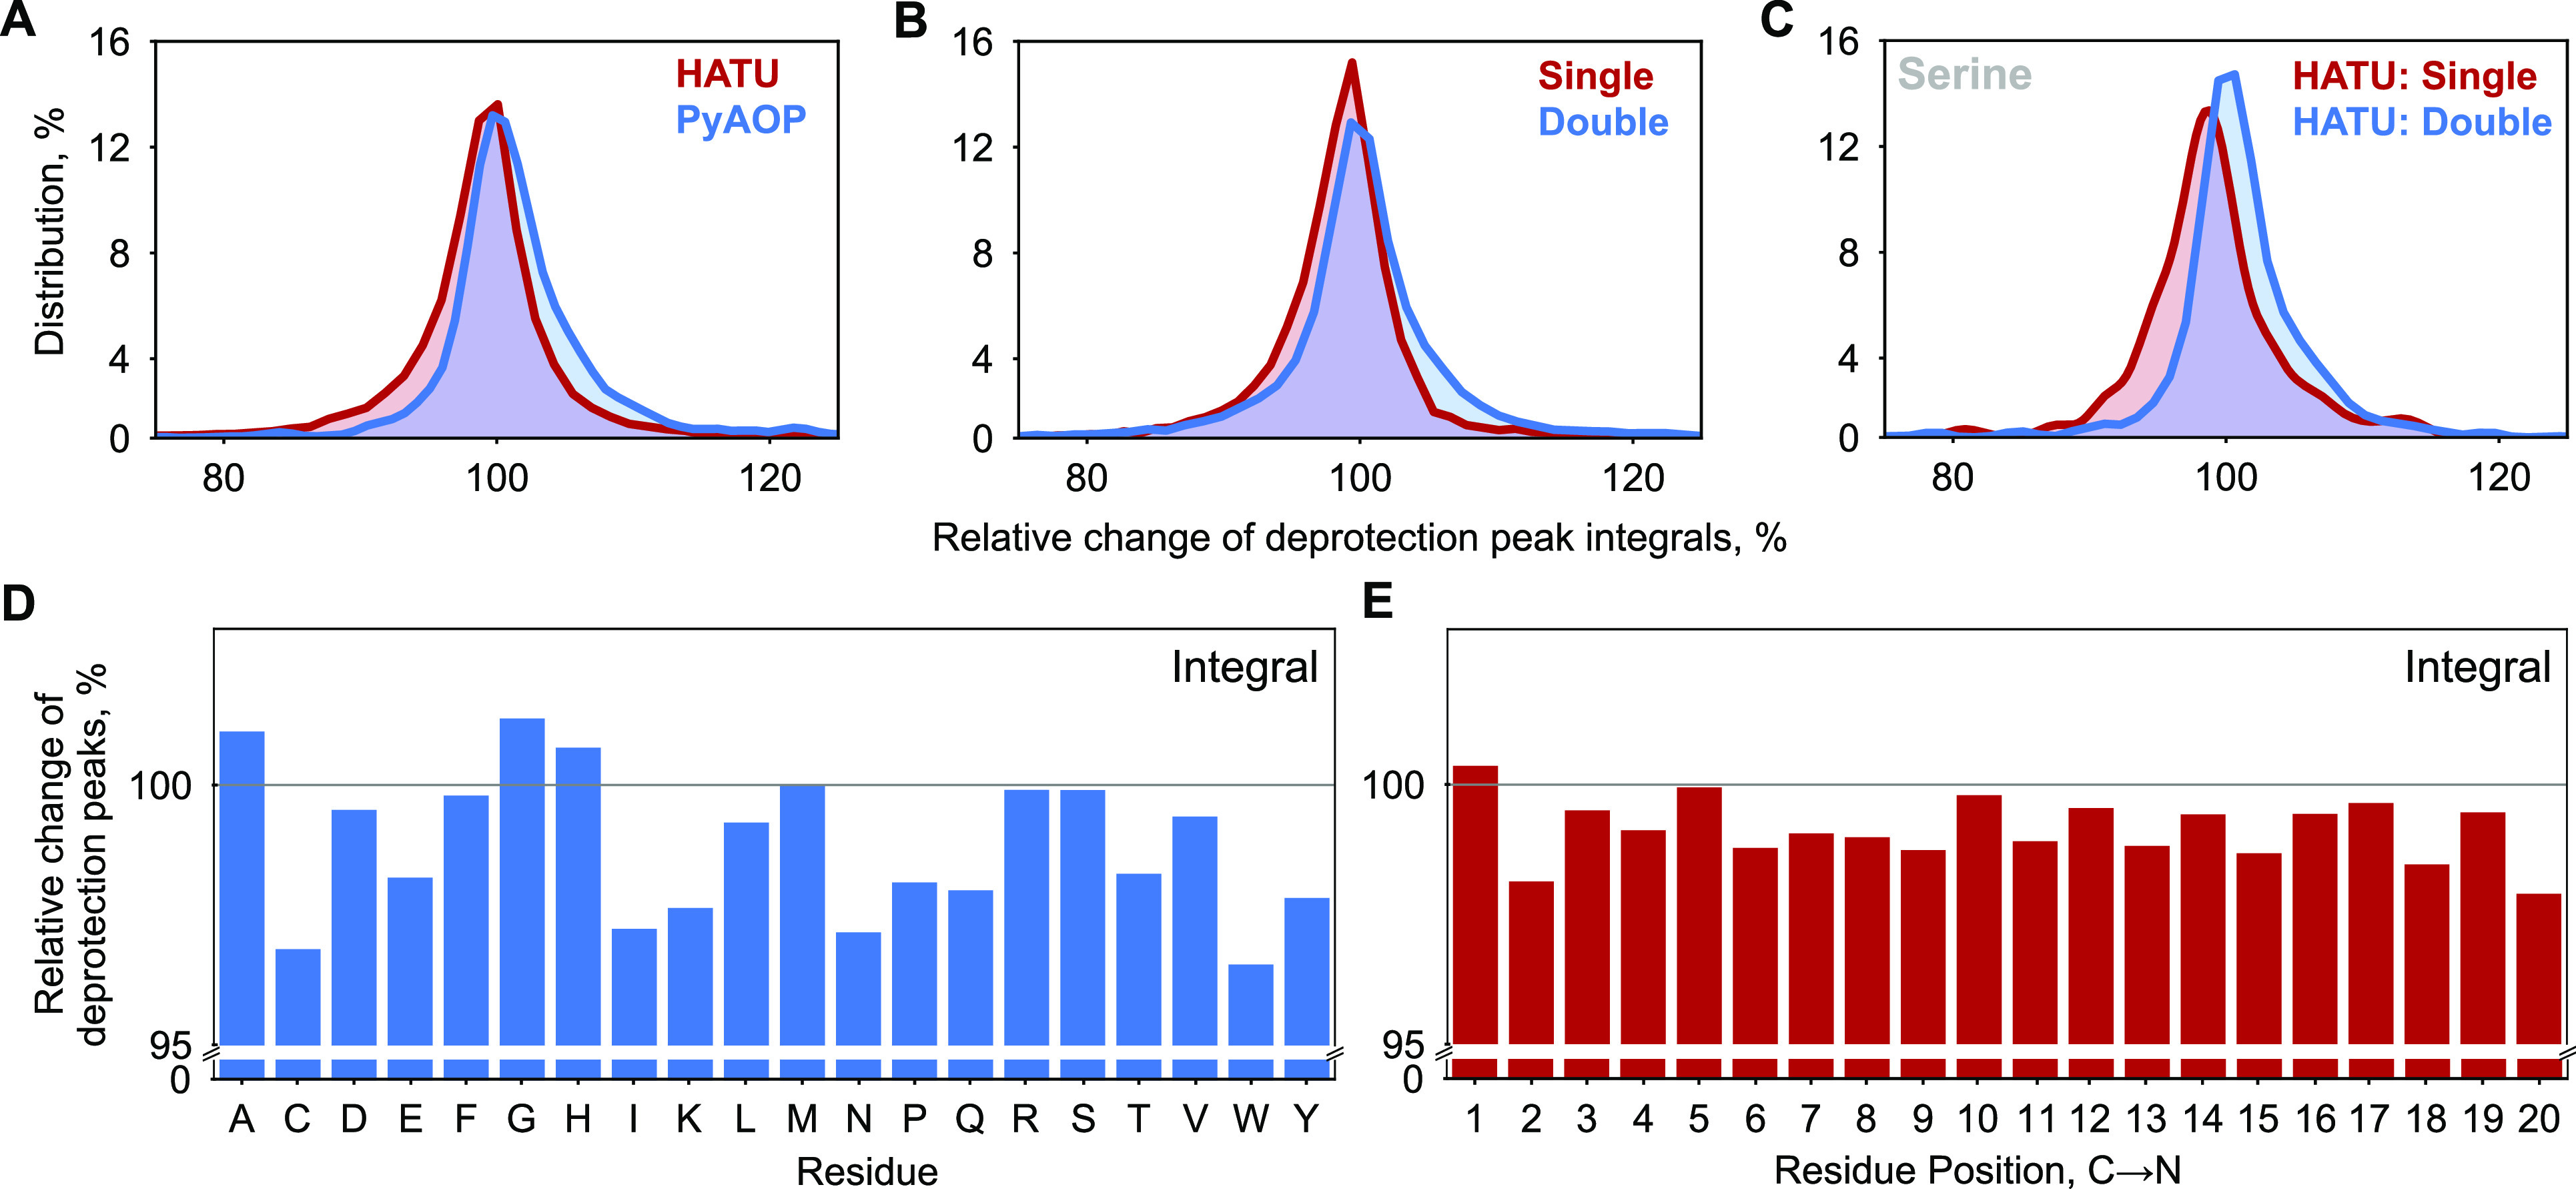
Synthesis data analysis identifies areas for further optimization. Histograms showing the comparative distribution of the relative change of deprotection peak integrals filtered across the entire reaction step data set by (A) coupling agent (HATU, PyAOP), (B) coupling strokes (single, double), and (C) coupling of serine from the HATU subset with single coupling stroke to the HATU subset with double coupling strokes. The mean value and the distribution as a whole move toward the ideal relative change of 100% in all the latter cases. The integrals were normalized to the integral of the preceding reaction step. An integral greater than 100% only indicates that the present reaction was better than the preceding step. Single corresponds to 520 μL of DIEA, 5.2 mL of amino acid (0.4 M), and 5.2 mL of activator solution (0.38 M); double corresponds to twice the amount of chemicals as in a single set of coupling strokes. (D) Mean values of amino acid-specific deprotection peak integrals are shown. The integrals are normalized relative to the previous deprotection peak integrals. (E) Mean values of deprotection peak integrals at different positions are shown. Residue position preaggregation is the same as the position of the amino acid in the synthesis step. Residue position postaggregation is the nth synthesis step after the aggregating step. The analysis is based on the optimized recipe for each individual amino acid, except Trp which needs to be optimized further.