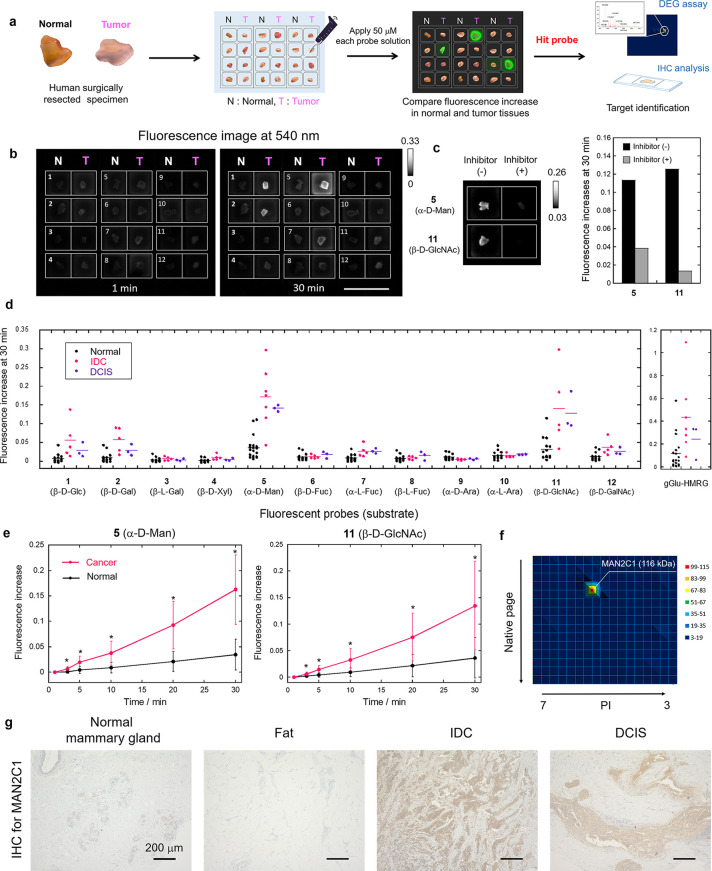
Figure 3.
Screening of glycosidase-reactive fluorescent probes for the detection of breast tumors. (a) Flowchart of screening using human surgical normal tissue and tumor specimens. (b) Example of screening using surgically resected frozen human breast IDC and normal tissues. The compound number of the applied probe is shown on each well. Probe solution was prepared with PBS (−) containing 0.5% v/v DMSO as a cosolvent. [fluorescent probe] = 50 μM. Scale bar, 2 cm. (c) Fluorescence increase at 30 min in breast IDC tissues in the presence and absence of each inhibitor. Black bars: fluorescence increase in the absence of inhibitor. Gray bars: fluorescence increase in the presence of inhibitor. [fluorescent probe] = 50 μM, [swainsonine] = 500 μM for probe 5 (α-d-Man), [PUGNAc] = 500 μM for probe 11 (β-d-GlcNAc). (d) Comprehensive analysis of intact glycosidase activities in normal breast, IDC and DCIS tissues using 12 fluorescent probes or gGlu-HMRG (N = 14–20 for normal, N = 5–7 for IDC, N = 3 for DCIS). Fluorescence increase represent increase at 30 min from 1 min after addition of fluorescent probes. Black, pink, and purple dots represent fluorescence increases in normal breast, IDC and DCIS tissues, respectively. (e) Time-dependent fluorescence increase of probe 5 (α-d-Man) and 11 (β-d-GlcNAc) in breast normal and cancer tissues. Black lines represent fluorescence increases in normal breast tissues. Pink lines represent fluorescence increases in breast cancer (IDC + DCIS) tissues. Error bars represent s.d. *P < 0.05 by Welch’s t-test. (f) DEG assay for IDC tissue using probe 5 (α-d-Man). MAN2C1 (116 kDa) was identified by peptide mass fingerprinting analysis from the fluorescent spot on 2D gel. (g) IHC staining for MAN2C1 in normal mammary gland, fat, IDC and DCIS tissues. Scale bars, 200 μm.

