Figure 4.
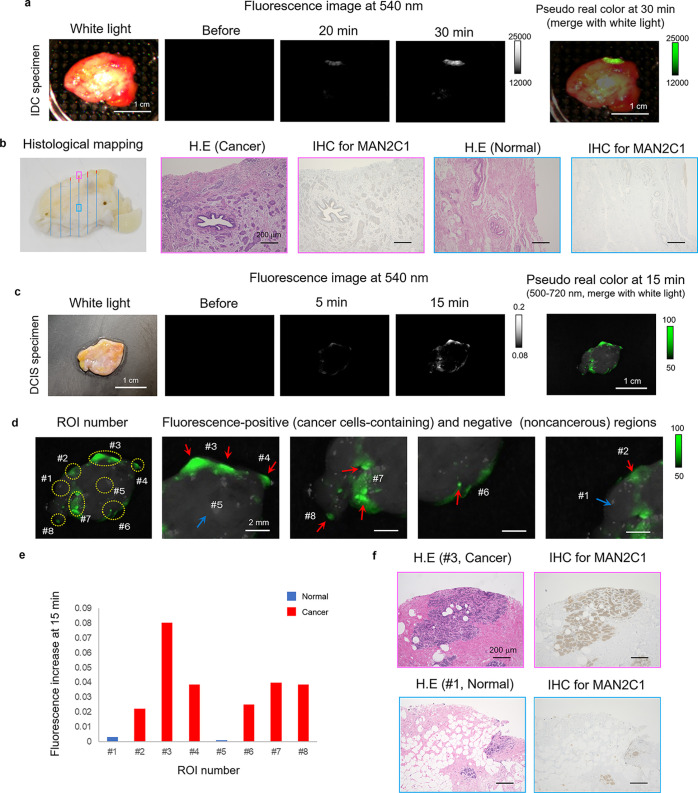
Application of α-mannosidase-reactive fluorescent probe to breast cancer-specific imaging. (a) Time-dependent fluorescence image of surgically resected fresh human IDC specimens containing both normal and cancer tissues after administration of HMRef-αMan. Probe solution was prepared with PBS (−) containing 0.5% v/v DMSO as a cosolvent. Scale bar, 1 cm. [fluorescent probe] = 50 μM. (b) Histological mapping of the specimen: red lines show IDC and blue lines show no tumor (left). Histological analysis and IHC analysis for MAN2C1 of boxed regions with strong fluorescence activation (pink box) or with no fluorescence activation (blue box). Scale bar, 200 μm. (c) Time-dependent fluorescence image of surgically resected frozen human DCIS specimen containing both normal and cancer tissues after administration of HMRef-αMan. Probe solution was prepared with PBS (−) containing 0.5% v/v DMSO as a cosolvent. Scale bar, 1 cm. [HMRef-αMan] = 50 μM. (d) ROI number of the evaluated DCIS specimen (left). Fluorescence-positive (red arrows) and -negative (blue arrow) regions (right). Cancer cells were detected in all fluorescence-positive ROIs by histological analysis. Scale bar, 2 mm. (e) Fluorescence increase at 15 min in each ROI. Red bars show cancer-cell-containing regions and blue bars show noncancerous regions. (f) Histological analysis and IHC analysis for MAN2C1 of ROI #3 with strong fluorescence activation (pink box) or ROI #1 with almost no fluorescence activation (blue box). Scale bar, 200 μm.

