Figure 6.
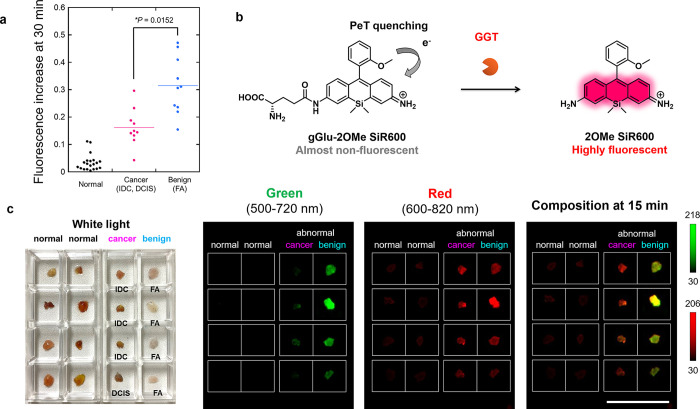
Application of fluorescent probes for the optical discrimination of breast cancer and benign breast lesions. (a) Fluorescence increase of HMRef-αMan in normal, cancer (IDC and DCIS) and benign (FA) breast tissues. The plots of normal, IDC, and DCIS show the same values as those in Figure 3d. HMRef-αMan tended to show higher fluorescence increases in benign FA tissues than in cancer tissues. *P < 0.05 by Welch’s t-test (N = 20 for normal, N = 7 for IDC, N = 3 for DCIS, N = 10 for FA). [HMRef-αMan] = 50 μM. (b) A newly developed activatable red fluorescence probe for GGT, gGlu-2OMe SiR600. The initial fluorescence of the probe is well quenched via a PeT process. (c) White light image (left), and dual-color fluorescence images (right) of breast normal, cancer (IDC or DCIS) and benign (FA) tissues obtained with the combination of HMRef-αMan and gGlu-2OMe SiR600. Fluorescence images were captured 15 min after administration of both probes. Probe solution was prepared with PBS (−) containing 1% v/v DMSO as a cosolvent. Ex/Em = 465 nm/515 nm long pass for green, Ex/Em = 570 nm/610 nm long pass for red, [HMRef-αMan] = 50 μM, [gGlu-2OMe SiR600] = 50 μM. Scale bars, 2 cm.

