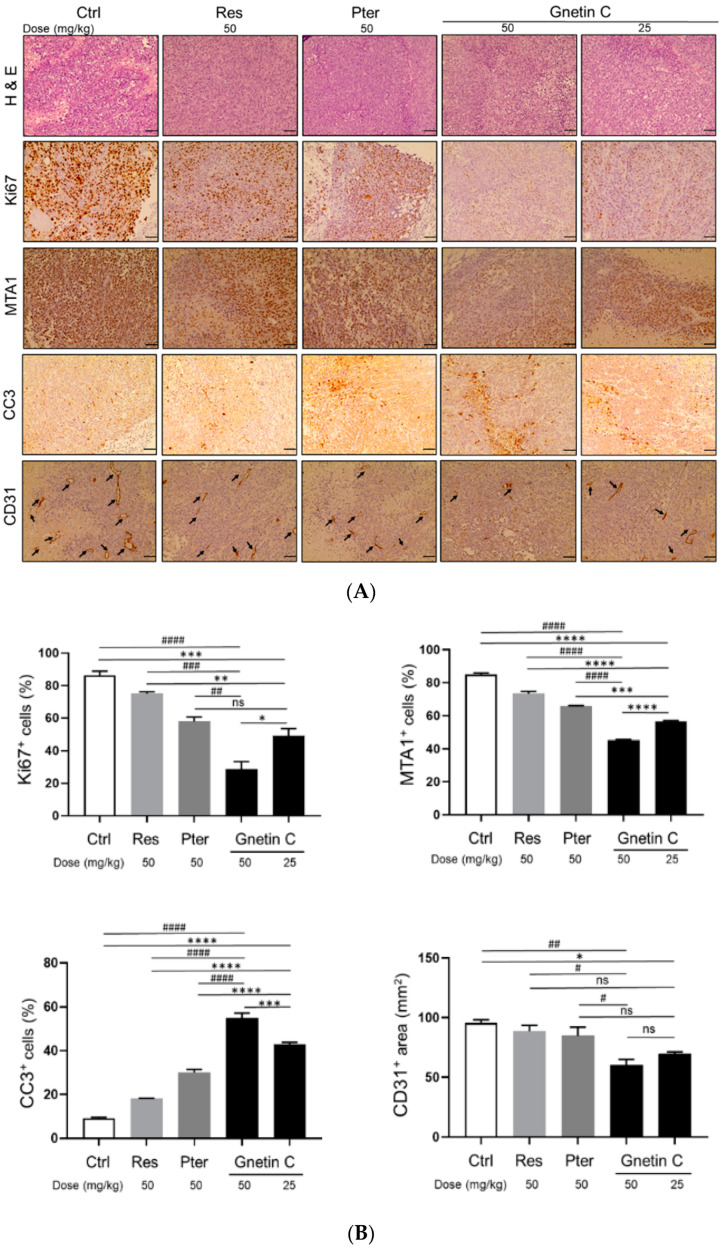
Figure 5.
Gnetin C inhibits proliferation and angiogenesis, and induces apoptosis in PC3M-Luc s.c. xenografts. (A) Representative images of H&E (top), Ki67 (second from top), MTA1 (third from top) cleaved caspase 3 (second from bottom), and CD31 (bottom)-stained sections of the tumor tissues from mice treated with compounds. H & E, MTA1, CC3 and CD31 are 20× images (scale bar, 50 μm); Ki67 is 40× image (scale bar, 20 μm). (B) Quantitative analysis of immunostainings showing drastic effect of Gnetin C treatment on markers of proliferation (Ki67), cell survival (MTA1), apoptosis (CC3), and angiogenesis (CD31) in tumor tissues. Arrows indicate microvessels on the bottom panels. Values are means ± SEM of cells counted in five separate fields per sample (n = 7/group), and the average count is expressed as a percent. ns non-significant; * p < 0.05; ** p < 0.01; *** p < 0.001; **** p < 0.0001 (significance vs. Gnetin 25); # p < 0.01; ## p < 0.01; ### p < 0.001; #### p < 0.0001 (significance vs. Gnetin 50) (two-way ANOVA).

