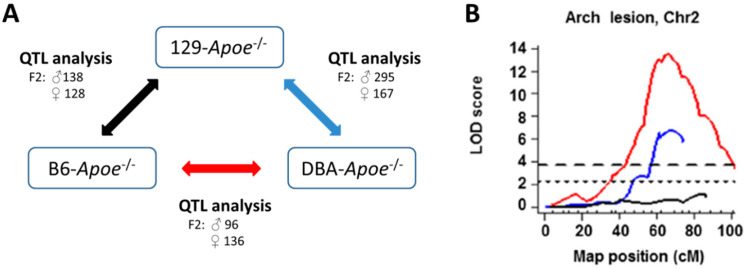
Figure 2.
Three-way QTL analyses. (A). F2 populations of intercrosses between B6-Apoe−/−, 129-Apoe−/− and DBA-Apoe−/− mice were used for the three-way QTL analyses. (B). LOD curves of Aath4 on Chr 2. LOD curves of a cross between B6-Apoe−/− and DBA-Apoe−/− (red line), a cross between DBA-Apoe−/− and 129-Apoe−/− mice (blue line), and a cross between B6-Apoe−/− and 129- Apoe−/− mice (black line) on Chr 2. The horizontal dashed and dotted lines represent thresholds for suggestive QTL (p = 0.63) and significant QTL (p = 0.05) determined in single locus scan of the cross between B6-Apoe−/− × DBA-Apoe−/− mice. The significance thresholds for LOD scores were determined by 1000 permutations using R/qtl software. Adopted from [29].

