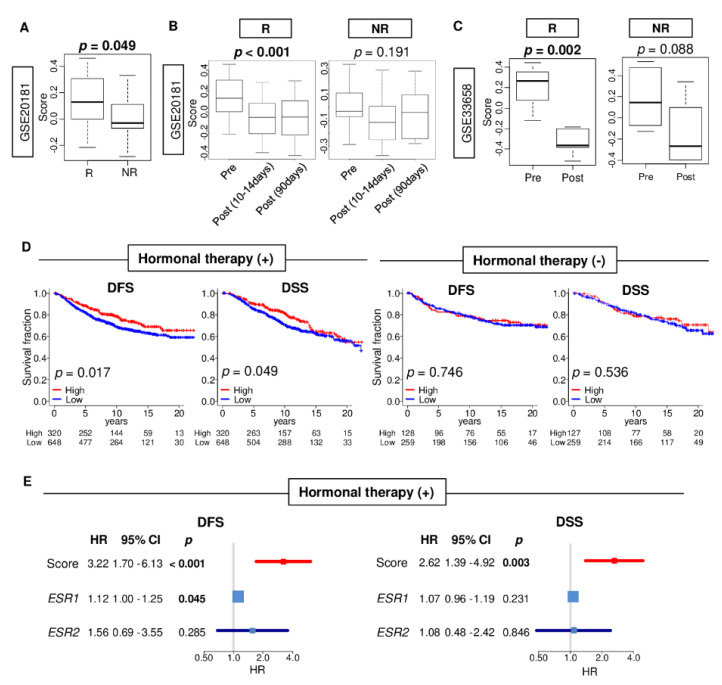
Figure 5.
Association of the estrogen response early score with treatment response to endocrine therapy in estrogen receptor (ER)-positive breast cancer. (A) A boxplot of the comparison of the score between response (R) and non-response (NR) group in the GSE20181 cohort (n = 176) that received letrozole. (B) Boxplots comparing the score between pre-treatment, post- (10–14 days) and post- (90 days) treatment tumors in the GSE20181 cohort. (C) Boxplots of the comparison of the score between pre- and post-treatment tumors in the response group and non-response group in the GSE33658 cohort that underwent anastrozole and fulvestrant (n = 22). p-value was calculated by one-way ANOVA test. (D) Kaplan-Meier with log-rank p-value between low (blue) and high (red) score with disease-free survival (DFS) and disease-specific survival (DSS) in the treatment group and non-treatment group in the METABRIC cohort. The top one-third was defined as the high score group within the cohort. (E) Forrest plots of the estrogen response early score, ESR1 and ESR2 expression with DFS and DSS in an endocrine therapy group in the METABRIC cohort. The p-value was calculated by Cox regulation model. HR; hazard ratio, CI; confidence interval.

