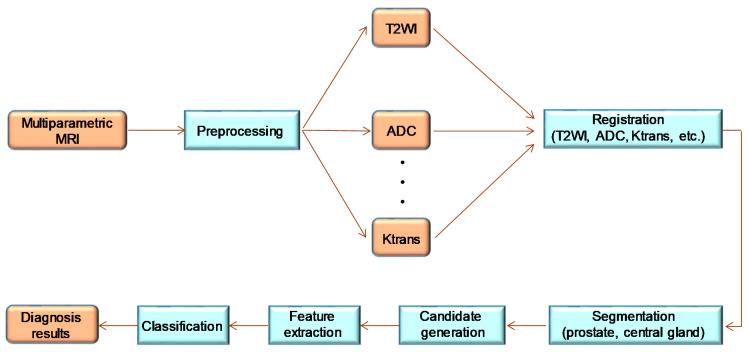
Figure 1.
Workflow diagram of a typical prostate CADx system in Reference 44 (Wang et al., 2014); this is a modified figure from the reference. The orange squares indicate the data (original scan and pre-processed image), and the light blue squares indicate the data and processing applied to the image.

